HS50_advance_level 2.pdf - 第155页
Stud ent Gu ide HS-5 0 Adva nced II 07/2 002 Ed ition 6 Control & Co mmunicatio n 25 0RQLWRULQJWKH $ [LV&RQWURO 6\VWHP The di agram a bove represents the ke y signal s tha t can be m onitor using a n…
07/2002 Edition Student Guide HS-50 Advanced II
6 Control & Communication
24
3RVLWLRQ&RQWURO
Under the operational mode of position control an attempt is made to retain a programmed posi-
tion. The target (setpoint) position stored in the main memory of the microprocessor is compared
with the actual position (counter register). If a position deviation is detected (the target or setpoint
position is not equal actual position) then the servo amplifier is actuated via the V nom in such a
way that the mechanism returns back to the programmed position (target or setpoint position).
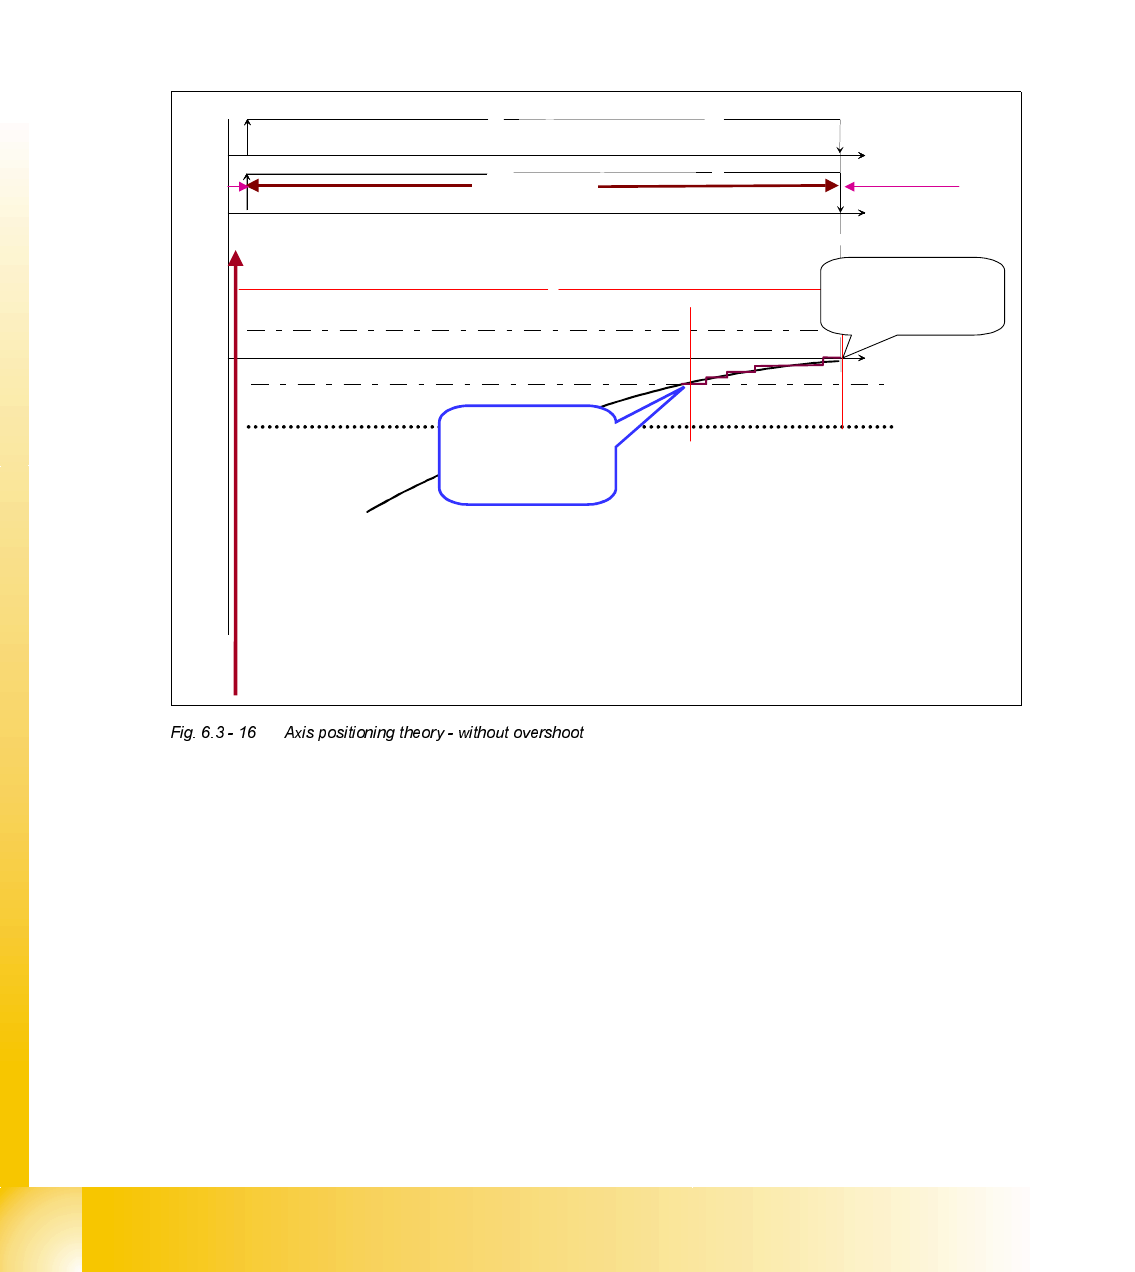
$[LV3RVLWLRQLQJ7KHRU\ZLWKRXW2YHUVKRRW
On short travel distances and at SIPLACE HS-50 X and Y axis positioning very often occurs with-
out an overshoot. The end signal is triggered 10 ms after the axis first crosses the allowed devia-
tion of position. If within this time the axis moves out of allowed position deviation the 10 ms timer
is deactivated.
ACTUAL-, is NOMINAL position signal
mechanical movement and position counting
End signal
Time
Time
Time
ACTUAL-, is NOMINAL position signal
mechanical movement and position counting
End signal
Time
Time
Time
Position counting
Allowed deviation of position
Allowed deviation of position
Time for “SSK” (10 ms)
is used for the end
signal at asymptotic
approach
positioning
occurrence
position
controlling
If there is no overshoot we get the end signal by asymptotic approach.
From here the Axis
moves with minimum
speed and with
reduced P
gain
End signal is triggered
position controlling
starts and the next axis
starts
X
position
Positioning
corridor
Student Guide HS-50 Advanced II 07/2002 Edition
6 Control & Communication
25
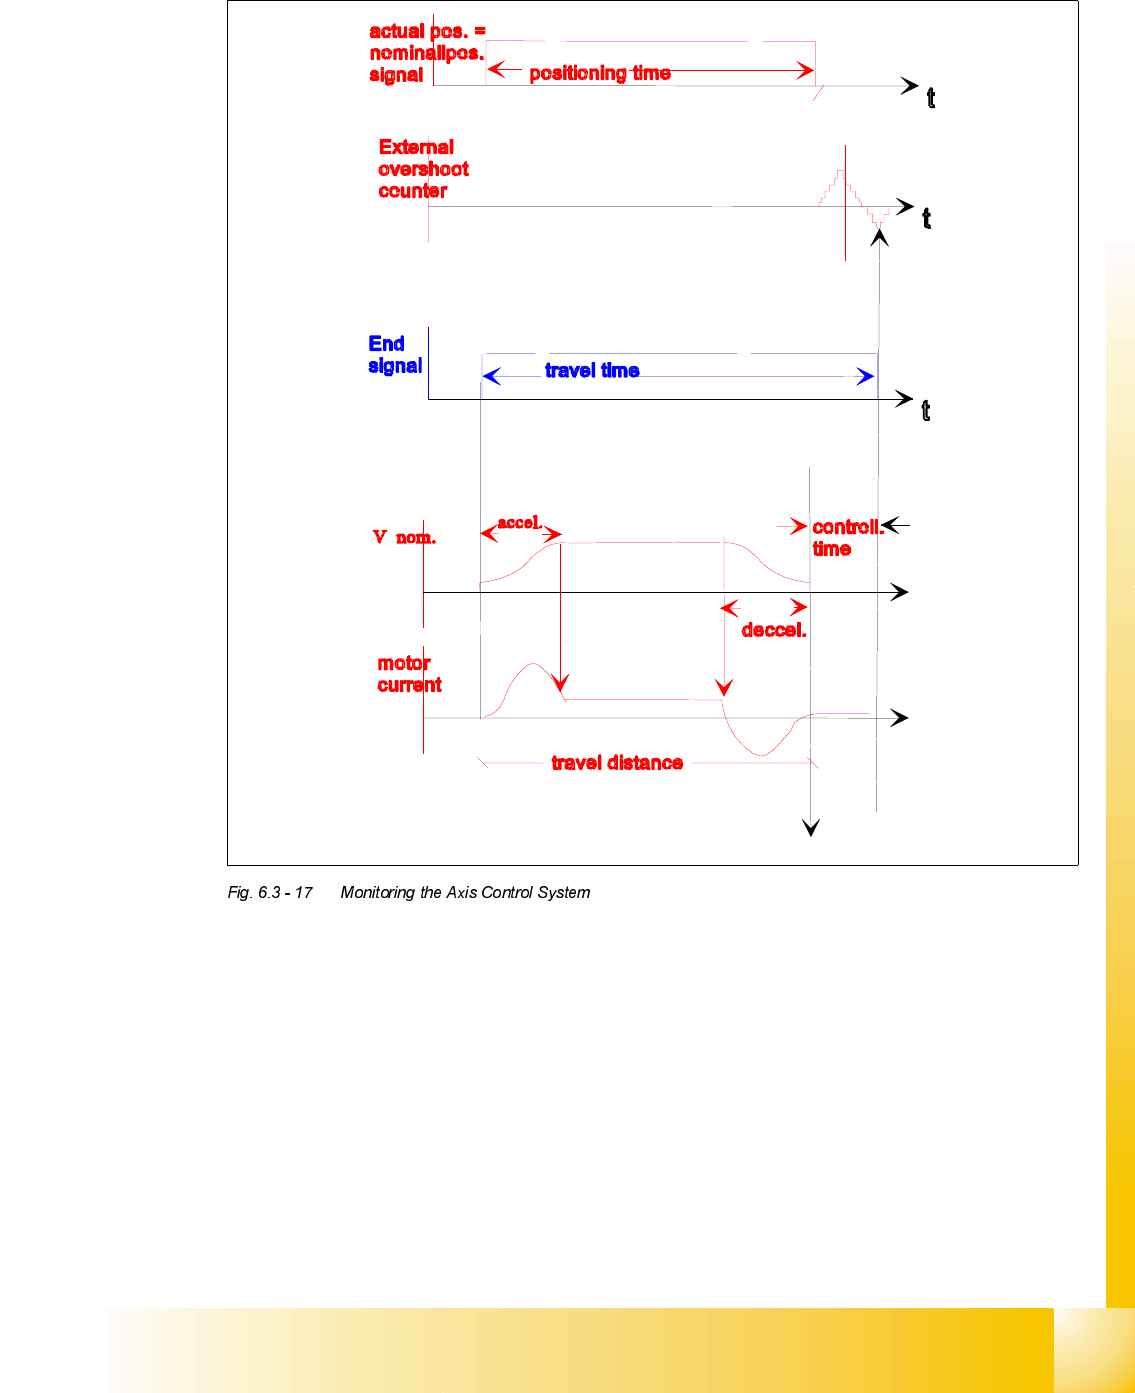
0RQLWRULQJWKH$[LV&RQWURO6\VWHP
The diagram above represents the key signals that can be monitor using an oscilloscope, axis test
box and axis test adapter.
On the axis test box there is a push button switch, this switch should normally be pressed. When
it is the End Signal waveform is measured by connecting the oscilloscope BNC lead to the adapter
card. In this state the ’End Signal’ connection at test box will not output the actual End Signal but
instead output the signal given when the target position is passed by the axis for the first time, this
is know as the ’Positioning Time’. If the push button is released the signals given are reversed.
On the diagram above we can see that the difference between ’Positioning Time’ and ’End Signal’
is determined by the size and quantity of the overshoots. This signal can be monitored at the test
box by connecting to the ’Position Deviation’ connector.
t
t
07/2002 Edition Student Guide HS-50 Advanced II
6 Control & Communication
26
Next on the diagram we can see the ’V nom’ waveform, which again can be measured from the
connector at the test box. We can clearly see the axis acceleration, followed by a period a full
speed, then the axis deceleration. Also note that the V nom voltage is at a minimum during the
final positioning phase, that is the time between ’Positioning Time’ and ’End Signal’.
Finally we see the motor current, which can be monitor directly at the Servo card or at the test
adapter in the case of the Star axis. Here we see the initial rise in motor current as the axis accel-
erates, followed by a low motor current as the motor runs at full speed, then a reverse current as
the motor decelerates and become a generator.
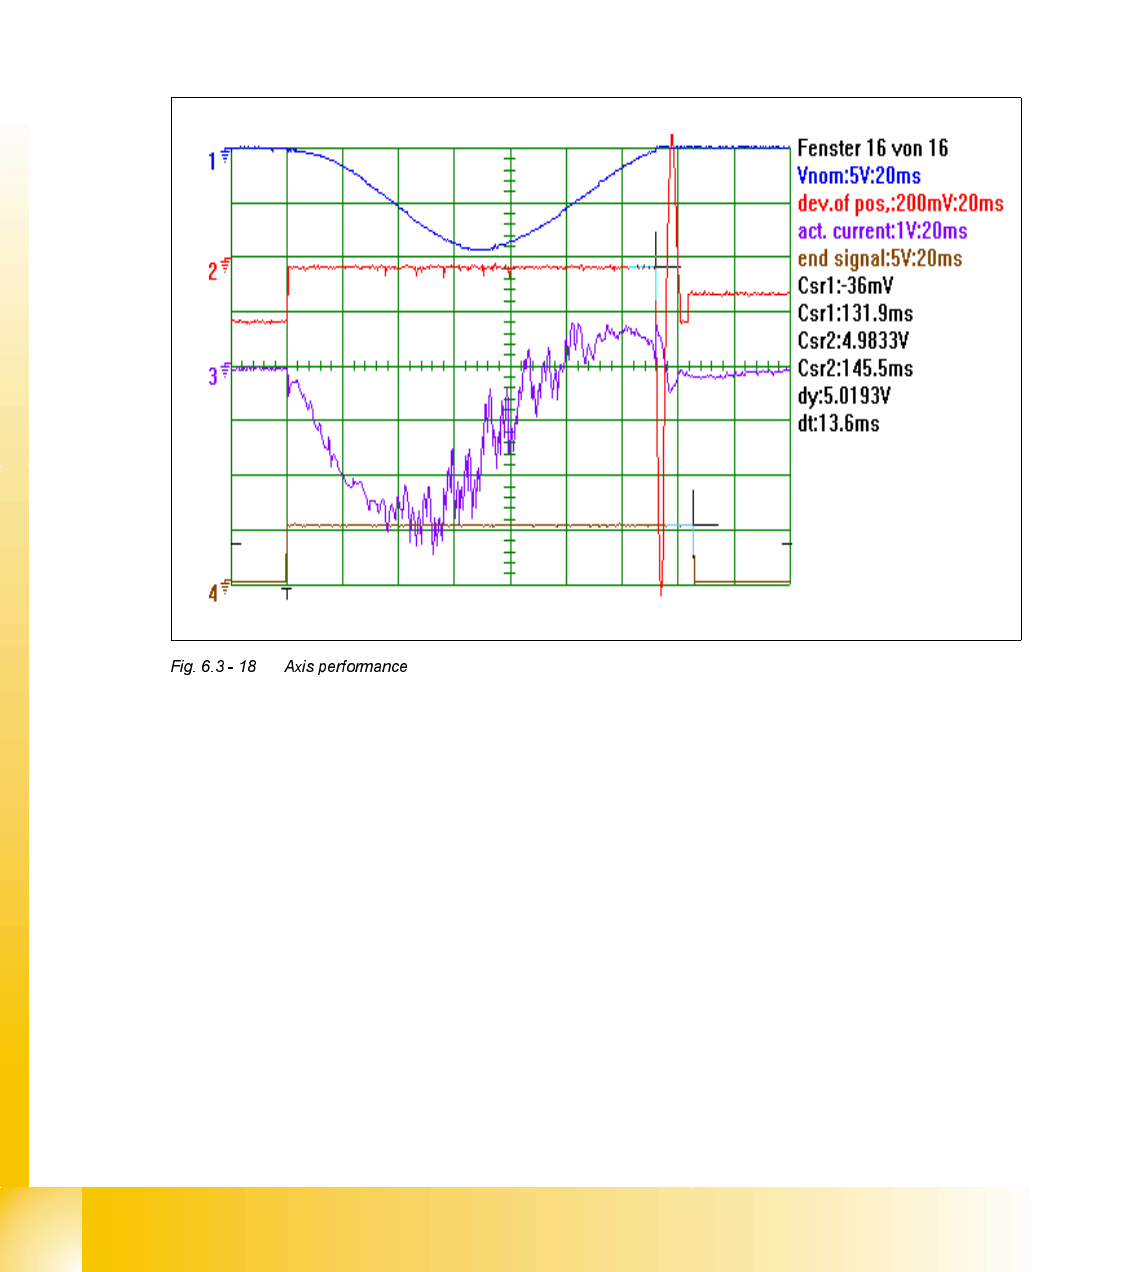
Above we see a screen shot from an oscilloscope being used to monitor the axis performance.
We should be able to relate this actual picture with the simplified diagram we described previously.
– Channel 1 shows the 'V nom' waveform.
– Channel 2 shows the 'Positional Deviation' with 2 large overshoots.
– Channel 3 shows the actual motor current.
– Channel 4 shows the 'End Signal'. Note how this is given as the overshoots are minimized.