HS50_advance_level 2.pdf - 第300页
07/2002 Editio n Student G uide HS -50 Advanc ed II 9 Z-Axis 40 '\QDPLFDGMXVWPHQW= D[LVI RUSODFHPH QWFRQW DFWOH VVSLFN XS &KHFNLQJW KHG\ QDPLF SHUIRU PDQFHRIWKH =D[LV – Use th…
Student Guide HS-50 Advanced II 07/2002 Edition
9 Z-Axis
39
&RQWURO
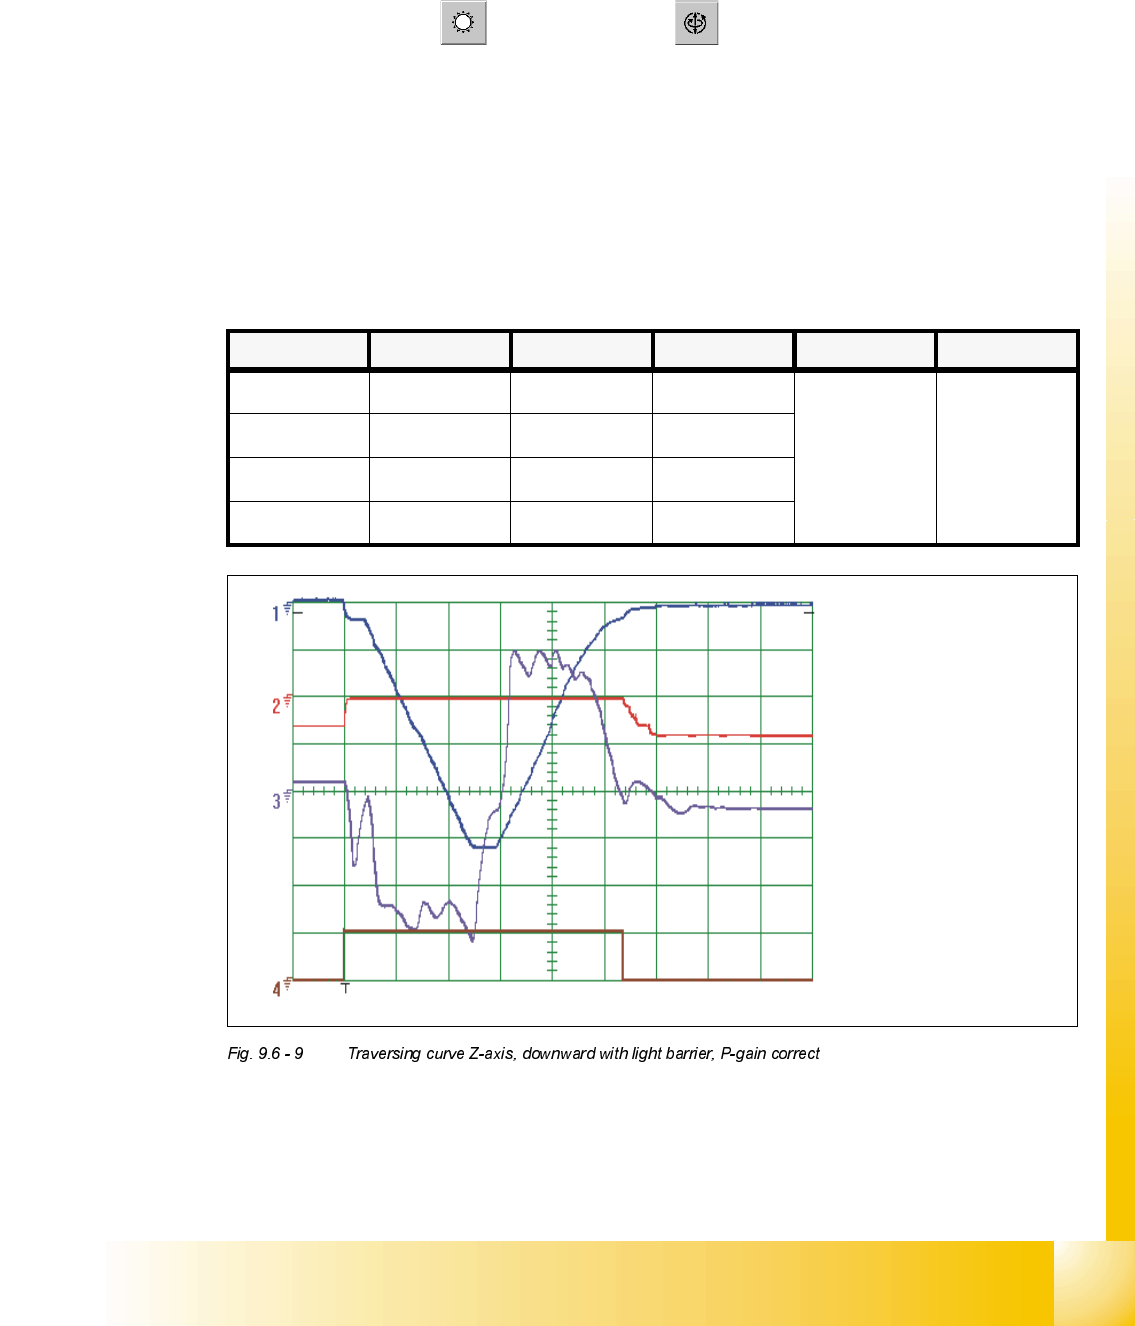
&RQWURORI3*DLQZLWK/LJKW%DUULHU0RGH
6,7(67
➠ Select "C&P Heads" ==> "Axis functions" ==> "Select Z-axis" ==> "Adjust P-gain"
==> "Edit and accept values: Positioning mode downward = with light barrier on the bottom;
positioning mode upward = absolute".
➠ If necessary, press the START button.
2VFLOORVFRSH6HWWLQJV
.
Z- axis downward
&KDQQHO 6LJQDO &RXSOLQJ <'HIOHFWLRQ 7ULJJHU ;'HIOHFWLRQ
CH1 Vnominal DC 1.0 V/ Div
CH 1
negative
10% pre
5 ms/ Div
CH2 deviat. of pos. DC 1.0 V/ Div
CH3 actual value DC 2.0 V/ Div
Ch4 end signal DC 5.0 V/ Div
Sollwert /
Vnominal
Positionsabweichung
/
deviation of position
Stromistwert /
actual current
Endemeldung /
end signal
07/2002 Edition Student Guide HS-50 Advanced II
9 Z-Axis
40
'\QDPLFDGMXVWPHQW=D[LVIRUSODFHPHQWFRQWDFWOHVVSLFNXS
&KHFNLQJWKHG\QDPLFSHUIRUPDQFHRIWKH=D[LV
– Use the SITEST program to check the Z axis dynamic performance.
– Select a traversing path of 685 digits and continuous operation.
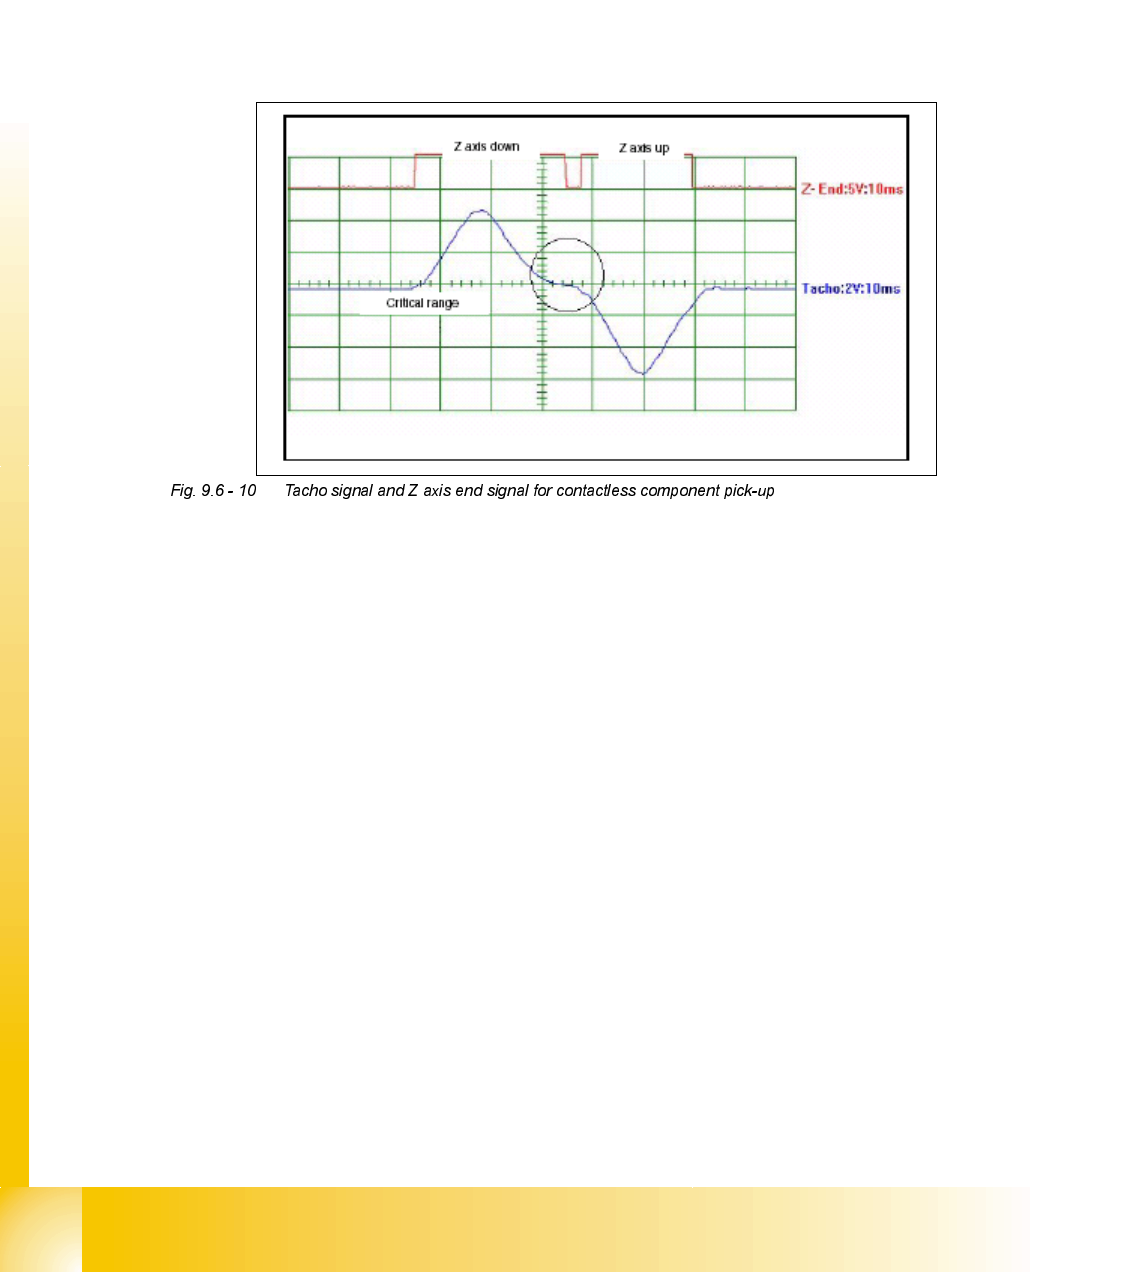
– Check the positioning times with the oscilloscope against the oscillogram in Fig. 9.6 - 10 and
the setting instructions for the Z axis.
6HWWLQJWKHG\QDPLFSHUIRUPDQFHRIWKH=D[LV
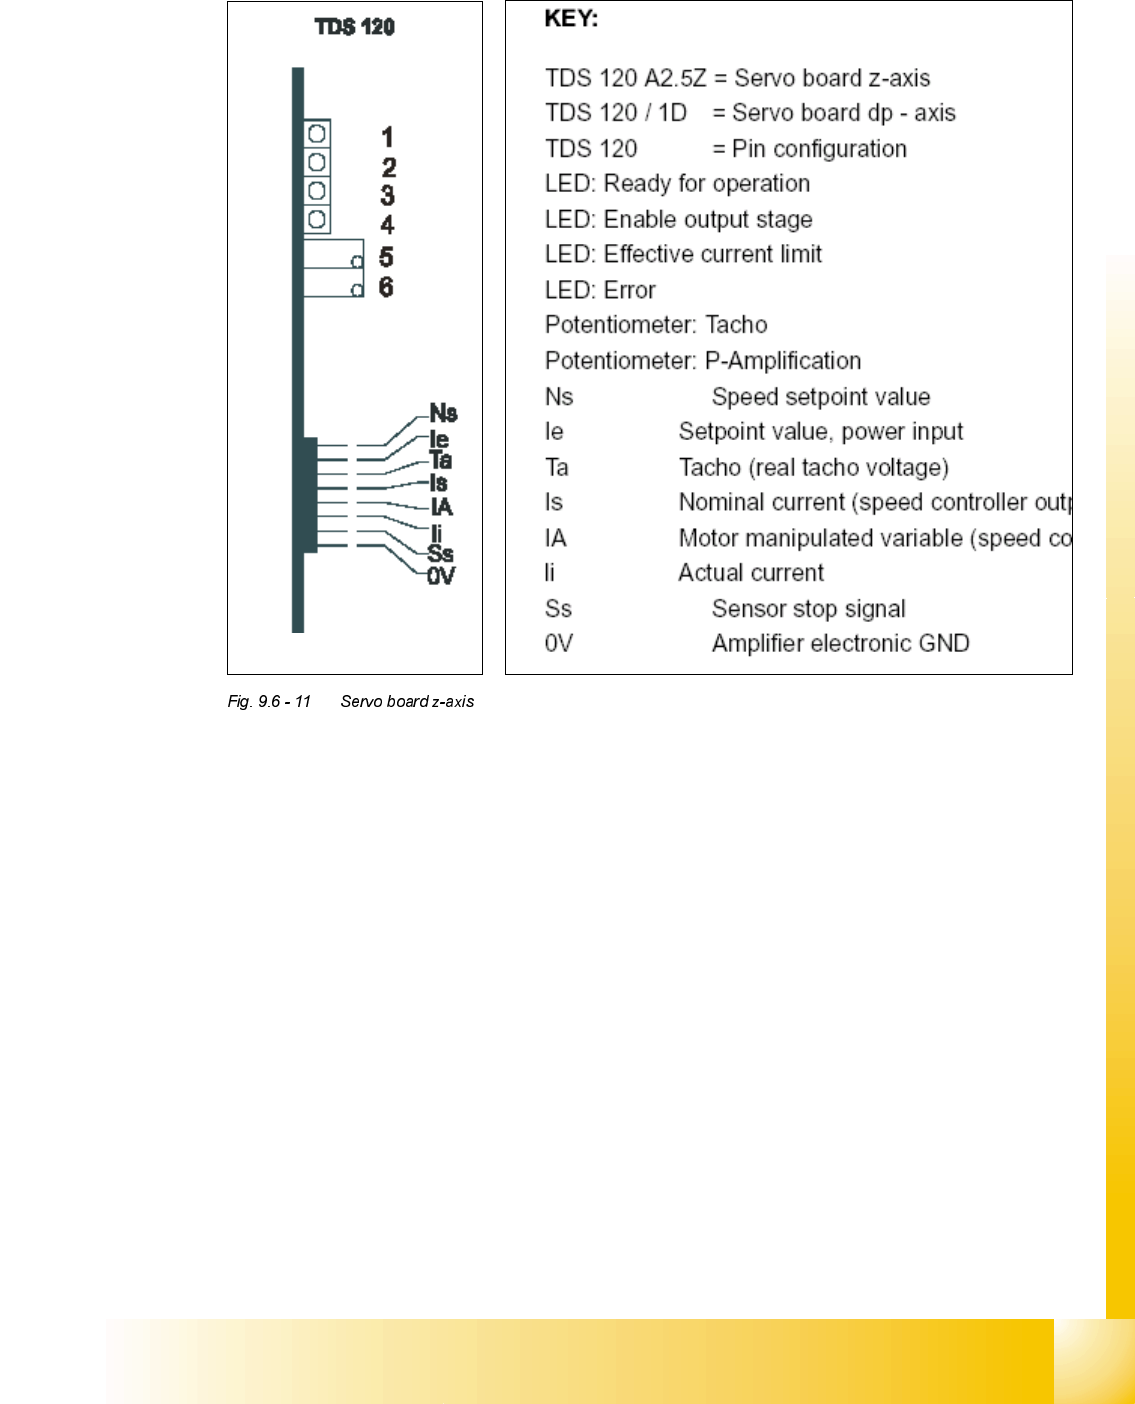
– Connect the 2-channel oscilloscope to the tacho signal measuring point on the servo-
amplifierboard and to the end signal measuring point on the axis control board (see setting
instructions).
– Place the components intended for contactless pick-up.
– Use the potentiometer to set the P gain on the servo-amplifier board so that the tacho signal
follows the curve shown in the oscillograms in Fig. 9.6 - 10 and Fig. 9.6 - 11.
– Make the following settings on the oscilloscope:
Tacho signal:
Voltage 2 V/Div
Time base 10 msec
End signal:
Voltage 5 V/Div
Time base 10 msec
If you select a finer voltage resolution or time base, you can then investigate the curve more
closely for a tendency to vibrate.
Student Guide HS-50 Advanced II 07/2002 Edition
9 Z-Axis
41
Examine the tacho signal in the region of the falling edge of the end signal, and make the following
settings on the oscilloscope:
Tacho signal:
Voltage 200 mV/Div
Time base 5 msec
End signal:
Voltage 5 V/Div
Time base 5 msec
Fig. 7.6 - 4 shows an oscillogram with the P-gain set correctly. The tacho signal curve drops
continuously in the region of the falling edge of the end signal.