10_Application_News_No_LC_26_ADI_049
LC - 26 -A DI- 049 Liquid C hromatography Mas s Spectrometry Analysis of Vitamin A in serum using CLAM- 2000 /LC-MS/MS LC/MS ■ Introduction Vitamin A, is a group of unsaturated nutritional organic compounds that include …
LC-26-ADI-049
Liquid Chromatography Mass Spectrometry
Analysis of Vitamin A in serum using
CLAM-2000/LC-MS/MS
LC/MS
■ Introduction
Vitamin A, is a group of unsaturated nutritional organic
compounds that include retinol, retinal, retinoic acid, and
several provitamin A carotenoids (most notably beta-
carotene).[1][2] Vitamin A has multiple functions: it is important
for growth and development, for the maintenance of the immune
system and good vision.[3][4] Vitamin A is needed by the retina
of the eye in the form of retinal, which combines with protein
opsin to form rhodopsin, the light-absorbing molecule[5]
necessary for both low-light (scotopic vision) and color vision.[6]
Vitamin A also functions in a very different role as retinoic acid
(an irreversibly oxidized form of retinol), which is an important
hormone-like growth factor for epithelial and other cells.[7]
LC-MS/MS has become essential tool for monitoring the
concentration of Vitamin A in biological samples due to its high
level of sensitivity and specificity however, manual sample
preparation often involves several complicated steps which can
lead to erroneous results.
Also, lengthy and tedious sample preparation procedures along
with large number of samples, make LC-MS/MS a less
desirable method. Automated sample preparation module has
been shown to eliminate human error, as well as increase
laboratory efficiency in terms of throughput, enabling LC-MS/MS,
to find its place in the labs.
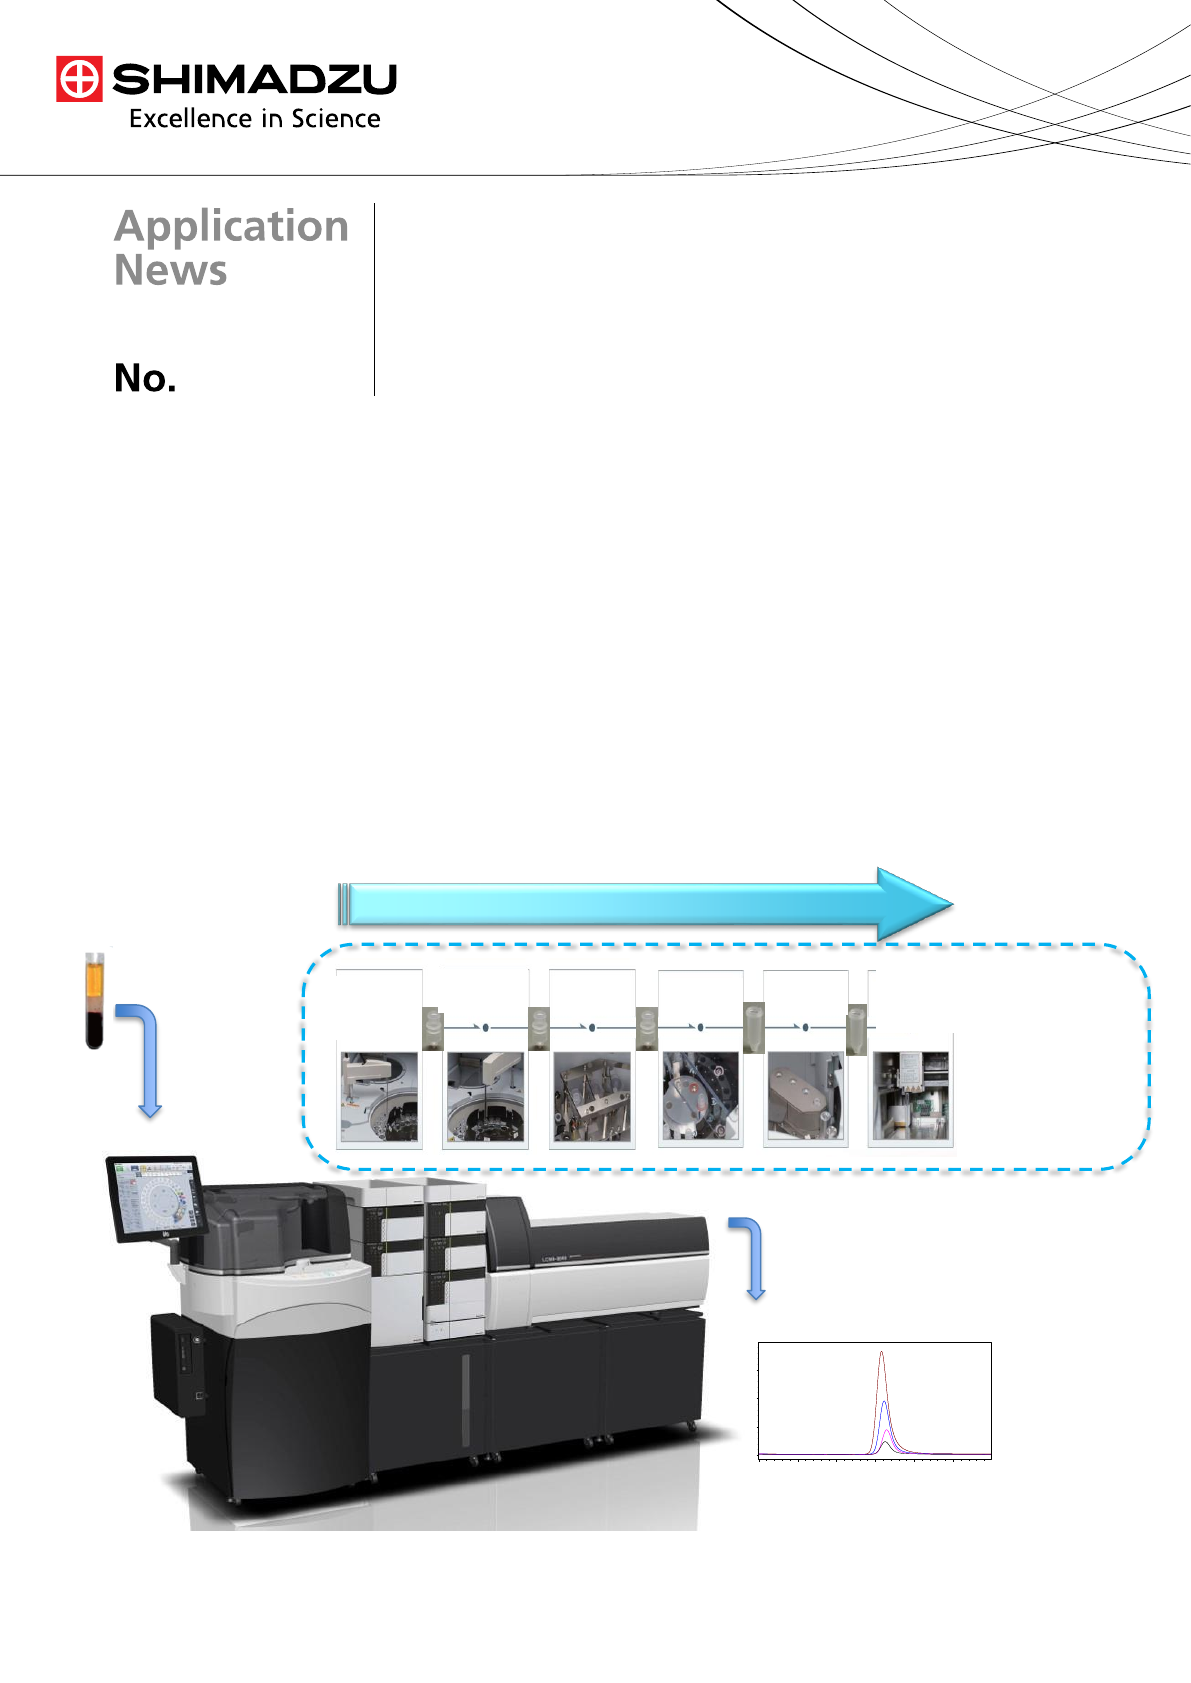
The ability to analyze Vitamin A by LC-MS/MS (LCMS-8040,
Shimadzu) using automated sample preparation (CLAM-2000,
“For research use only. Not for use in clinical diagnostics”
Shimadzu) is used to process large sample sets (Fig. 1). The
CLAM-2000 (Clinical Laboratory Automation Module), has the
ability to perform a variety of steps appropriate for automated
sample preparation, like precipitation, filtration, heating, shaking,
and pipetting. This system is seamlessly integrated with the LC-
MS/MS, requiring no human involvement after loading the
biological samples into the sample chamber. We validated the
data acquired by CLAMP-2000/LC-MS/MS, an automated
method using a home brew method for analysis.
Blood
serum
Place sample
collection tube in
CLAM-2000
Fig. 1 CLAM – 2000 and LC-MS/MS 8040 System
0.00 0.25 0.50 0.75 1.00 1.25 min
0.0
1.0
2.0
3.0
(x100,000)
1:Vi tami n A T IC(+) 2018 0511 _S_00 00031 7_Vit A(0000 )_01.l cd
1:Vi tami n A T IC(+) 2018 0511 _S_00 00031 8_Vit A(0000 )_02.l cd
1:Vi tami n A T IC(+) 2018 0511 _S_00 00031 9_Vit A(0000 )_03.l cd
1:Vi tami n A T IC(+) 2018 0511 _S_00 00032 0_Vit A(0000 )_04.l cd
1:Vi tami n A T IC(+) 2018 0511 _S_00 00031 7_Vit A(0000 )_01.l cd
1:Vi tami n A T IC(+) 2018 0511 _S_00 00031 8_Vit A(0000 )_02.l cd
1:Vi tami n A T IC(+) 2018 0511 _S_00 00031 9_Vit A(0000 )_03.l cd
1:Vi tami n A T IC(+) 2018 0511 _S_00 00032 0_Vit A(0000 )_04.l cd
Sample is
transferred to
LC-MS/MS
Automatically.
Fully automated sample preparation
Dispending
Samples
Dispending
Reagents
Shaking
Filtering
Heating
Sample
Transfer
Results without human
intervention
LC-26-ADI-049
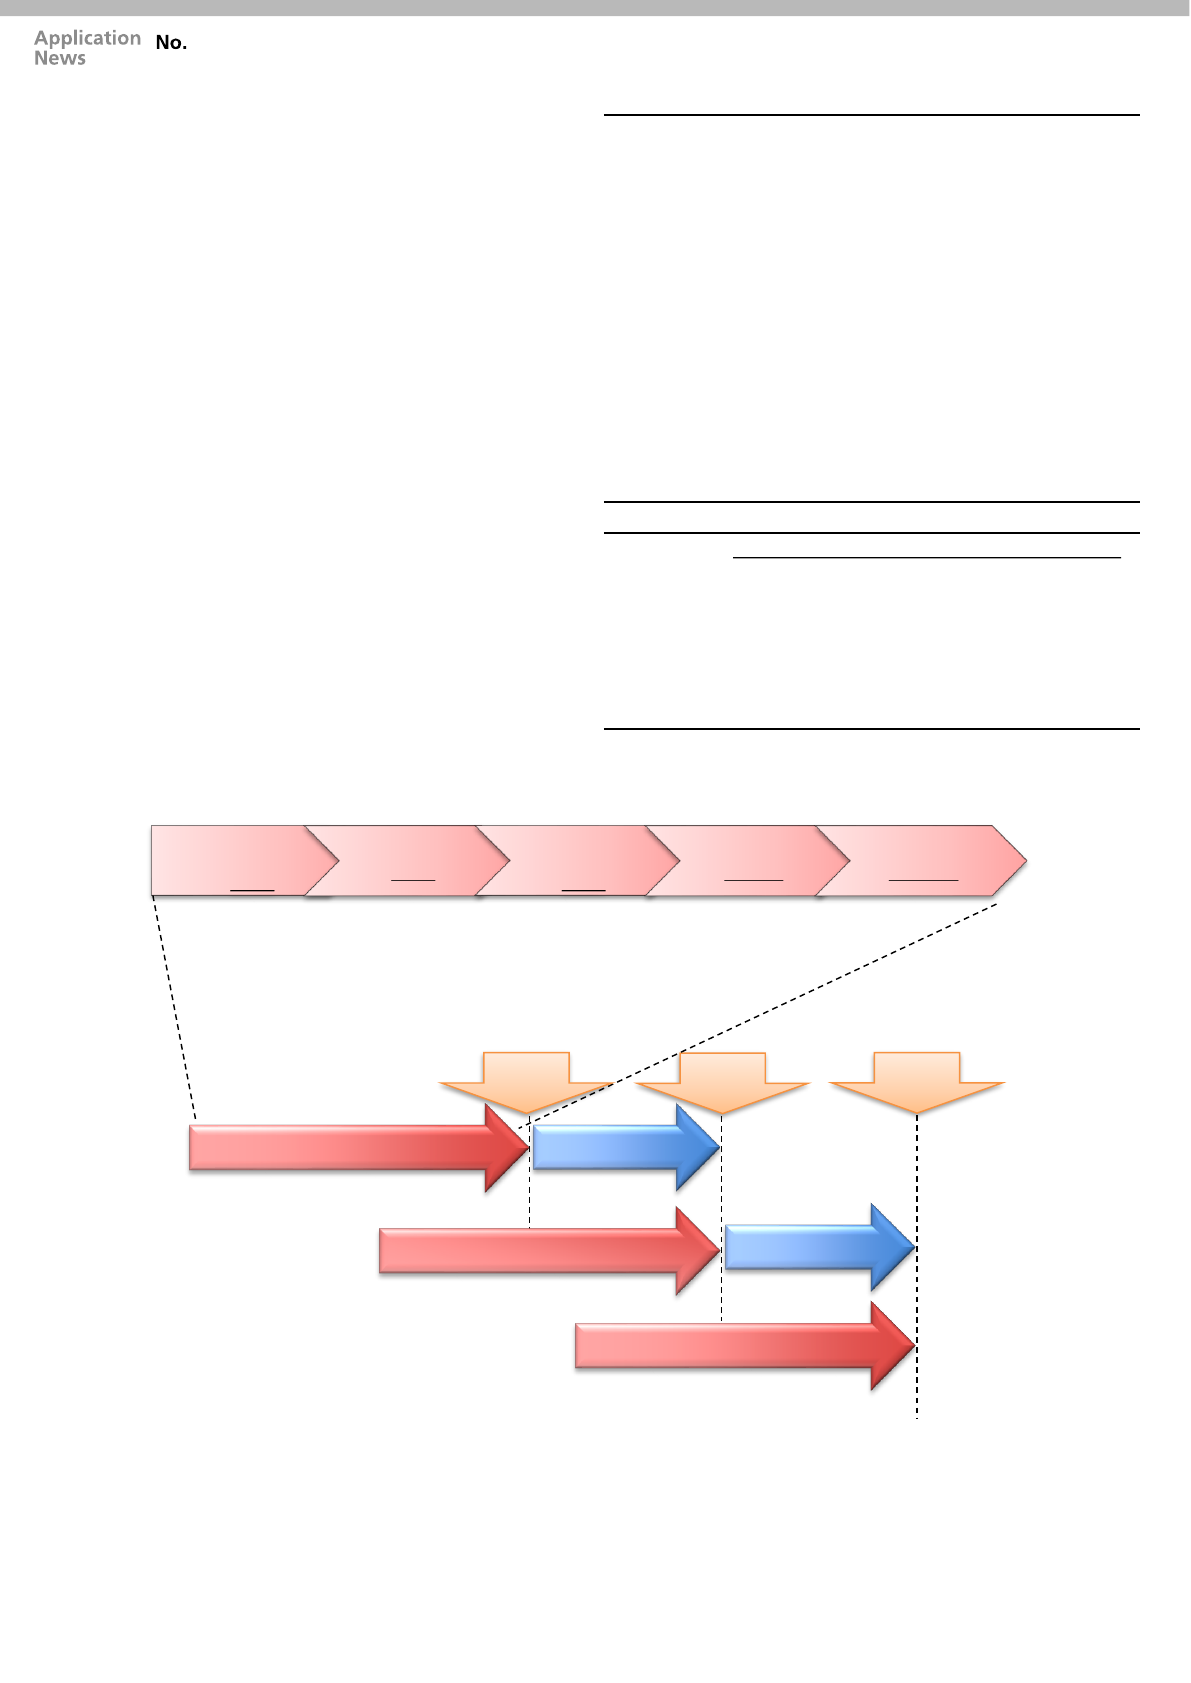
Fig. 2 Analytical Flow with Parallel Processing
■ Method
Vitamin A was analyzed using home brew method. Serum
sample was loaded directly into the automated sample
preparation system CLAM-2000.
The CLAM-2000 was programmed to perform protein
precipitation using acetonitrile followed by precipitation and
sample collection. Sample preparation involved taking 15 uL of
sample, adding to it 90 uL of precipitant solution. Following
filtration, the filtrated sample is then transported using an arm
from the CLAM-2000 to autosampler of LC-MS/MS for analysis
without any human intervention. In Fig. 2 the analytical
workflow which works parallel to sample analysis and sample
preparation is represented.
The LC-MS/MS instrument was equipped with an atmospheric
pressure chemical ionization source (APCI).
The sample was analyzed on column at 40°C with isocratic
mode with flow rate of 300 µL/min.
■ Analytical Conditions
The auto optimization feature of Lab Solution software was
used to optimize MS/MS conditions using Vitamin A standard.
The autosampler was used for injecting the standard.
LC-MS/MS conditions are described in Tables 1 & 2.
Two MRM transitions were recorded and summed for signal
integration.
The CLAM-2000 was programmed to perform sample
extraction by protein precipitation followed by filtration and
sample collection.
System
Column
Column Temperature
Mobile Phases
Flow Rate
Total Run Time
Injection Volume
System
Ionization
Probe Voltage
Temperature
Gas Flow
: Nexera X2 (high pressure binary gradient)
: Information available on request
: 40°C
: 0.1% Formic Acid in Methanol
: 300 µL/min
: 1.5 min
: 50 µL
: LCMS-8040
: APCI
: 4.5 kV (positive ionization)
: Interface: 350°C
Desolvation Line: 280°C
Heater Block: 300°C
: Nebulizing Gas: 3 L/min
Drying Gas: 15 L/min
Table 1 Analytical Conditions
MRM
Transitions
Name MRM CE Dwell Time (msec)
Vitamin A 269.15 > 93.00 -12 80
269.15 > 81.00 -21 80
Dwell Time
CID Gas
Pressure
: 63 msec
: 230 kPa
Quadrupole
Resolution : Q1: Unit Q3: Unit
Table 2 MS/MS Acquisition Parameters
Reagent
Dispensing
10 uL
Sample
15 uL
Reagent
Dispensing
90 uL
Shaking
50 secs
Filtration
150 secs
Sample Preparation 5.5 mins
LC-MS/MS
Analysis 1.5 mins
Sample Preparation 5.5 mins
Sample Preparation 5.5 mins
Sample
Injection
LC-MS/MS
Analysis 1.5 mins
Sample
Injection
Sample
Injection
LC-26-ADI-049
Table 6 Estrone QC Results
y = 1.0052x - 10.904
R² = 0.9316
0
500
1000
1500
2000
2500
0 500 1000 1500 2000 2500
CLAM
-2000 prp. Vitamin A Conc. (ng/mL)
Manual prep. Vitamin A Conc. (ng/mL)
Vitamin A sample preparation manually v/s CLAM-2000
Vit A Lower Range Upper Range Median Linear (Vit A)
0.00 0.25 0.50 0.75 1.00 1.25 min
0.0
1.0
2.0
3.0
(x100,000)
1:Vitamin A TIC(+) 20180511_S_00000317_Vit A(0000)_01.lcd
1:Vitamin A TIC(+) 20180511_S_00000318_Vit A(0000)_02.lcd
1:Vitamin A TIC(+) 20180511_S_00000319_Vit A(0000)_03.lcd
1:Vitamin A TIC(+) 20180511_S_00000320_Vit A(0000)_04.lcd
1:Vitamin A TIC(+) 20180511_S_00000317_Vit A(0000)_01.lcd
1:Vitamin A TIC(+) 20180511_S_00000318_Vit A(0000)_02.lcd
1:Vitamin A TIC(+) 20180511_S_00000319_Vit A(0000)_03.lcd
1:Vitamin A TIC(+) 20180511_S_00000320_Vit A(0000)_04.lcd
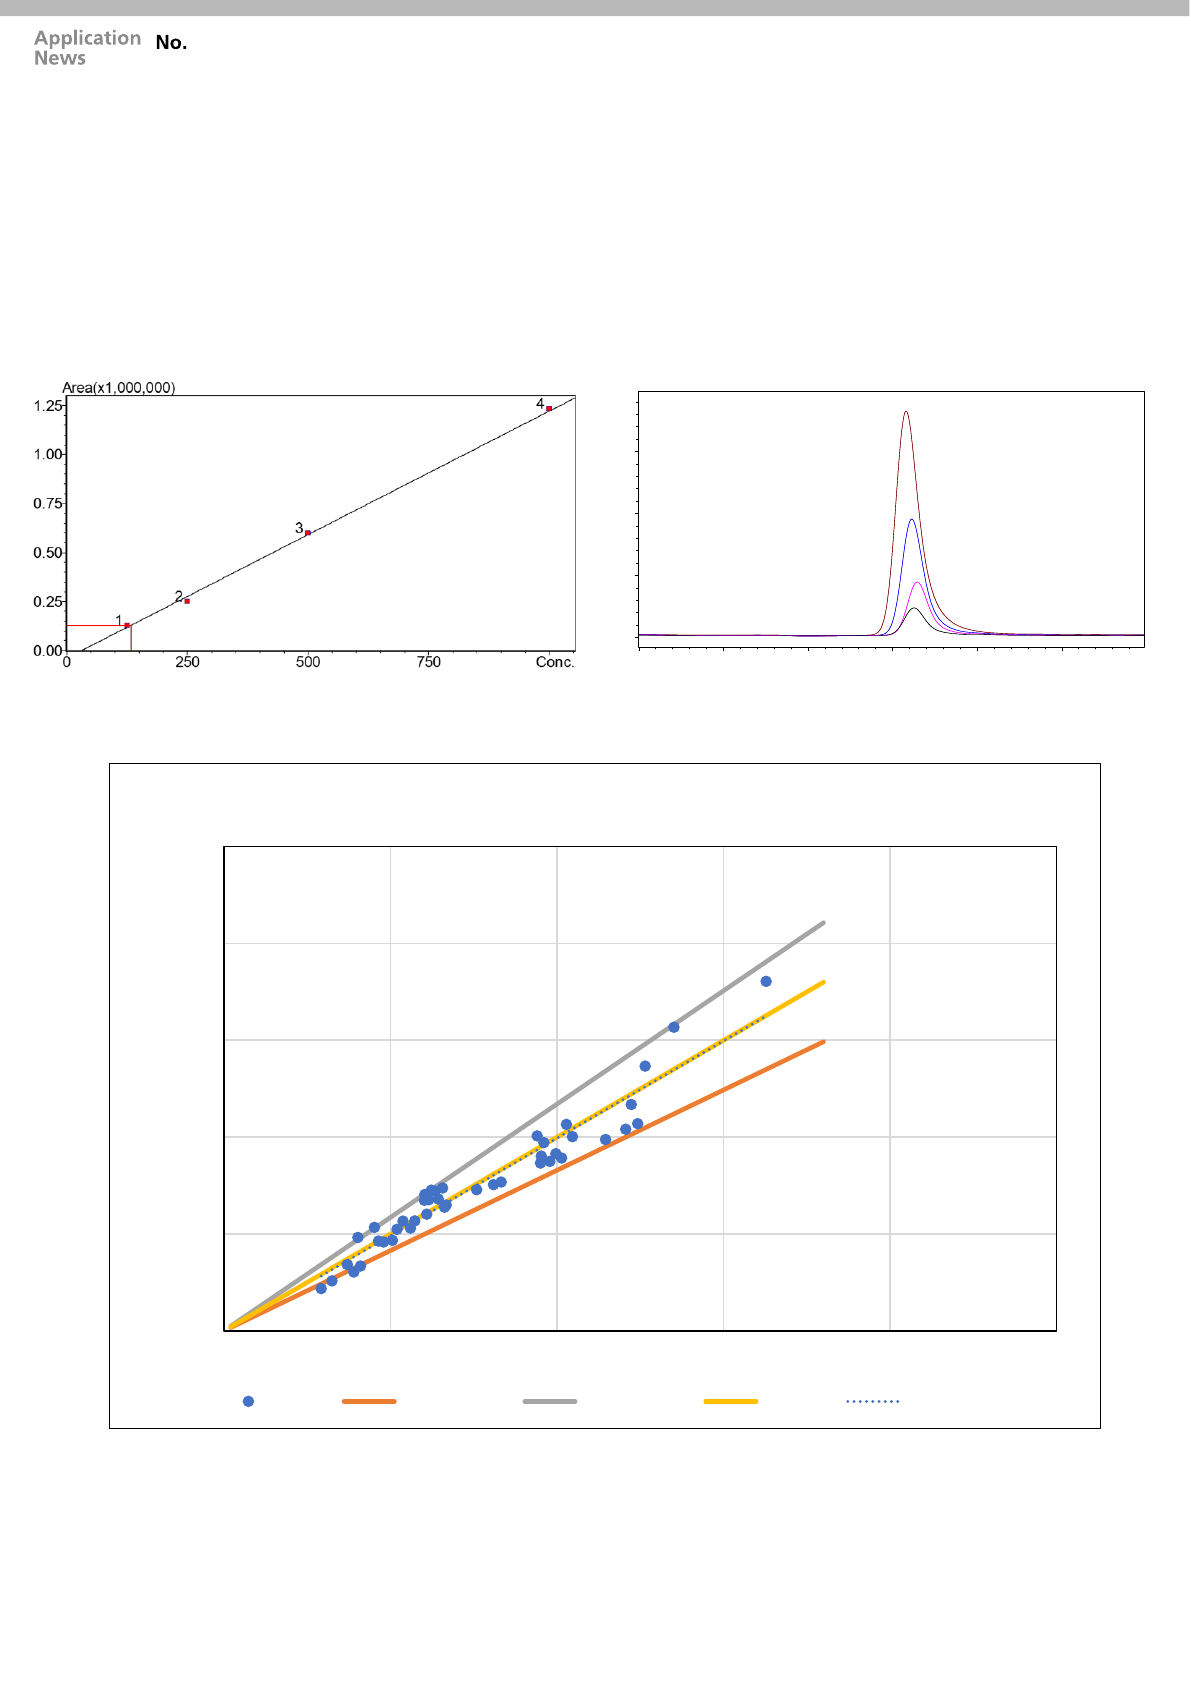
■ Calibration Curve
The Vitamin A standards, were serially diluted over a desired
clinical range of 125 - 1000 ng/mL and were placed on CLAM-
2000 for sample preparation, the way we carried out for samples.
The calibration curves showed good linearity (r
2
>0.996) over a
desired clinical range of 125 - 1000 ng/mL for Vitamin A (Fig. 3)
and calibration levels TIC’s are shown in (Fig. 4).
■ Data correlation with Manual method
Analytical data obtained using manual and automated sample
preparation methods for 43 human serum samples of Vitamin A
with known concentrations were studied and compared. In fig. 5,
orange line, grey line and yellow line represents the lower range,
upper range and median respectively. Percentage of Total error
(%TE) was used to define the upper and lower range of the
analyte. %TE refers to the amount of error that is allowable
without invalidating the interpretation of a test result.
As per Westgard guideline %TE of Vitamin A is ±17.1%. The
blue colored are the data points of Vitamin A obtained by CLAM-
2000.The r
2
(regression) obtained is 0.93 and r (correlation co-
efficient) is 0.96. Maximum data points of Vitamin A are within
the %TE.
Fig. 5 Data Correlation Plot between Automated Sample Preparation (CLAM – 2000)
and Manual Method (n=43 Human Serum Sample)
Fig. 3 Calibration Curve of Vitamin A (L1 –L4)
Fig. 4 TIC (Total Ion Chromatogram) of Calibrator