3OM-1208-011_w.pdf - 第202页
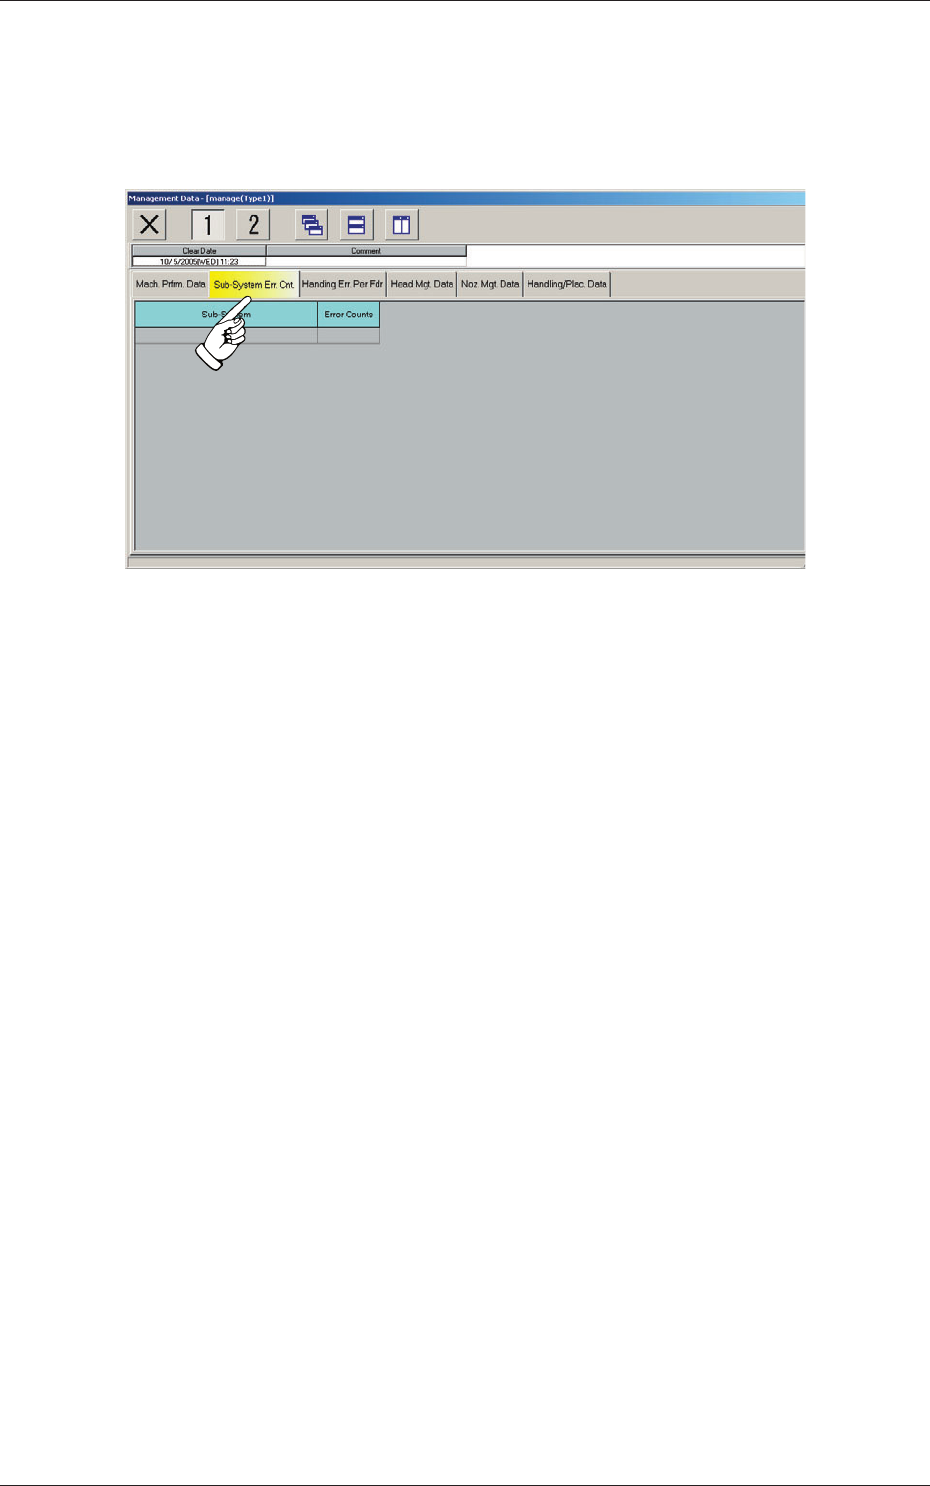
5-15 AIVEDT -ID 2.2 Sub-System Error Counts When the "Sub-System Err . Cnt." tab is pressed in the "Management Data" window , the following tab sheet appears inside the window . Fig. 3E7 "Sub-Sys…

5-14
AIVEDT-ID
Zones 1 through 5
1point errors (% of Total PEC recog. errors)
Shown are the total number of errors detected on the first fiducial
mark and the percentage of the detected errors per total number of
all errors detected by the PEC recognition function.
2point errors (% of Total PEC recog. errors)
Shown are the total number of errors detected on the second fiducial
mark and the percentage of the detected errors per total number of
all errors detected by the PEC recognition function.
3point errors (% of T
otal PEC recog. errors)
Shown are the total number of errors detected on the third fiducial
mark and the percentage of the detected errors per total number of
all errors detected by the PEC recognition function.
Local fiducial errors (% of
Total PEC recog. errors)
Shown are the total number of recognition errors in each individual
components and the percentage of the detected errors per total number
of all errors detected by the PEC recognition function.
Total PEC recognition errors
Shown is the total number of errors detected by the PEC recognition
function.
The number of errors detected by the global PEC recognition function
and the total number of errors detected by the BBR recognition function
are displayed.
0606-009
2.1 Machine Performance Data
5-15
AIVEDT-ID
2.2 Sub-System Error Counts
When the "Sub-System Err. Cnt." tab is pressed in the "Management Data"
window, the following tab sheet appears inside the window.
Fig. 3E7 "Sub-System Err. Cnt." Tab Sheet
The corresponding tab sheet enables the operator to view the total number of
errors that occurred on each device during automatic operation.
(1) Sub-System
Shown is the device on which an error occurred.
(2) Error Counts
Shown is the total number of errors that occurred on the device during
automatic operation.
0606-009
2.2 Sub-System Error Counts
5-16
AIVEDT-ID
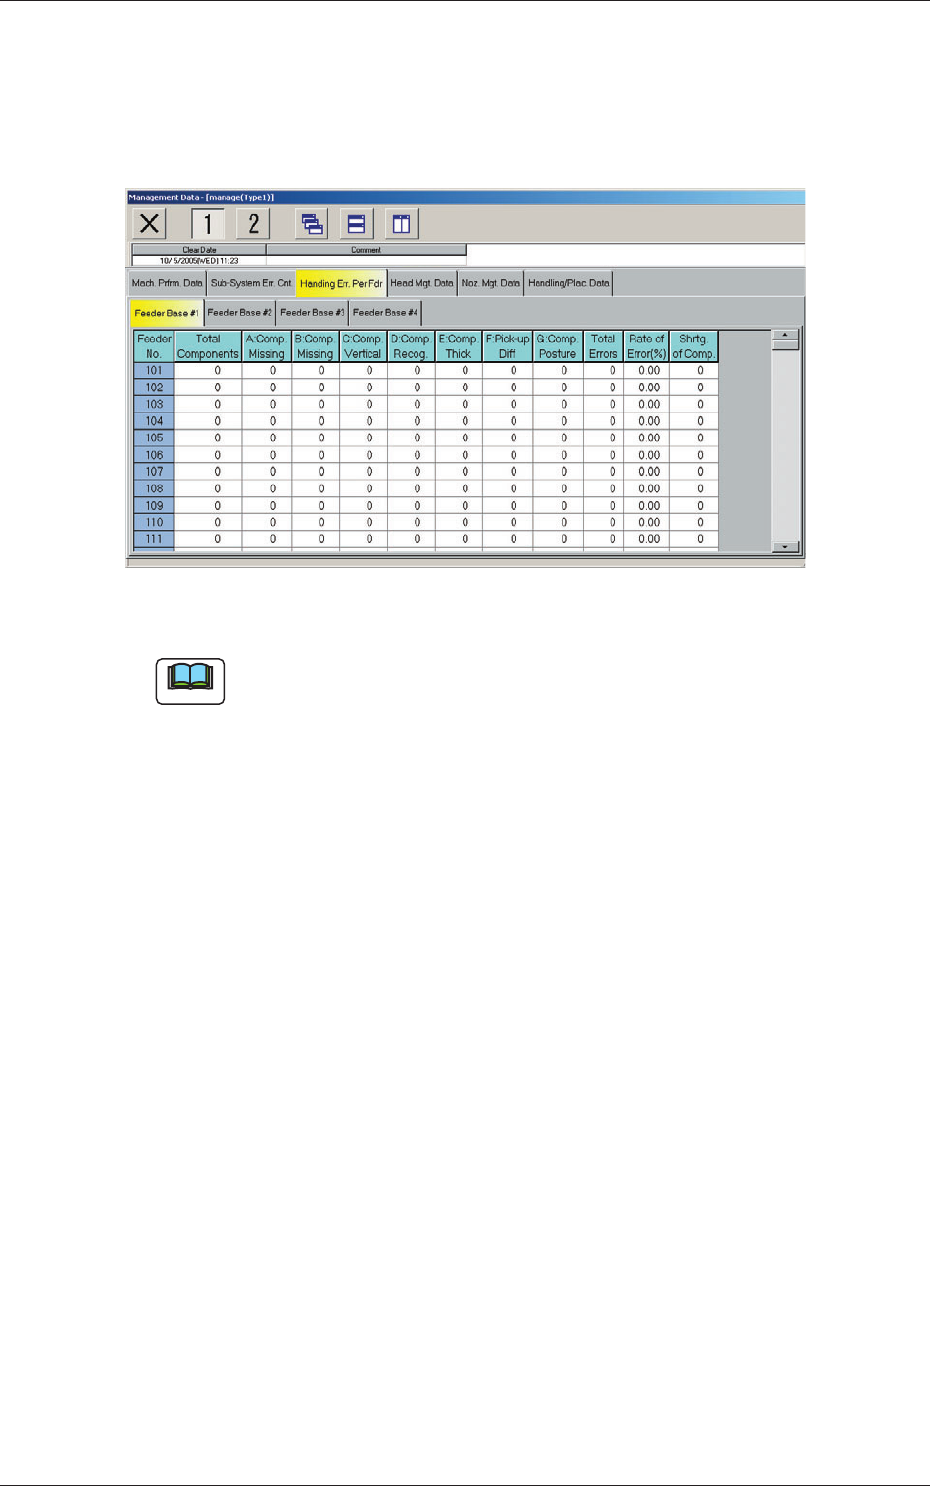
2.3 Handling Errors Per Feeder
When the "Handling Err. Per Fdr" tab is pressed in the "Management Data"
window, the following tab sheet appears inside the window.
Fig. 3E8 "Handling Err. Per Fdr" Tab Sheet
Note
The displayed tab sheet will look different, depending on which option is
selected.
The "Handling Err. Per Fdr" tab sheet is divided further into several tabs and
each tab sheet shows the handling errors per feeder on each individual feeder
bases.
When each tab is pressed, the corresponding tab sheet appears.
(1) Feeder No.
Shown are the feeder Nos.
(2) Total Components
Each text box shows the total number of picked components (number of
pickup actions) for each individual feeders.
(3) A: comp. Missing
Each text box shows the total number of missing components detected
by the linear measure detection sensor for each individual feeders.
(4) B: comp. Missing
Each text box shows the total number of missing components detected
through recognition operation for each individual feeders.
0606-009
2.3 Handling Errors Per Feeder