3OM-1208-011_w.pdf - 第204页
5-17 AIVEDT -ID (5) C: comp. V ertical Each text box shows the total number of vertical component errors detected by the linear measure detection sensor for each individual feeders. (6) D: comp. Recog. Each text box show…
5-16
AIVEDT-ID
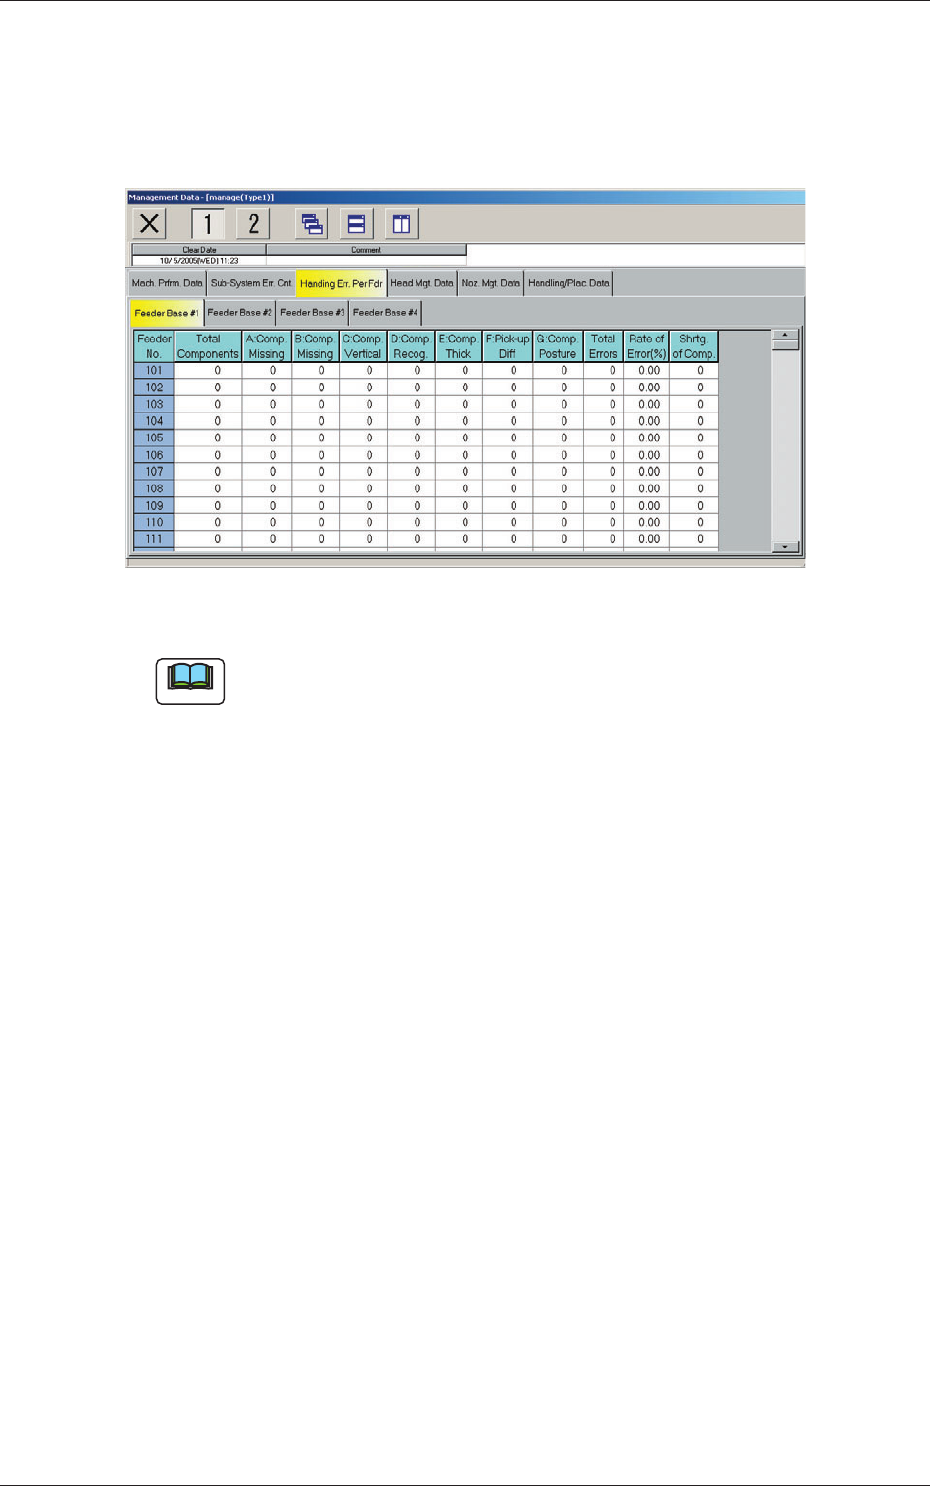
2.3 Handling Errors Per Feeder
When the "Handling Err. Per Fdr" tab is pressed in the "Management Data"
window, the following tab sheet appears inside the window.
Fig. 3E8 "Handling Err. Per Fdr" Tab Sheet
Note
The displayed tab sheet will look different, depending on which option is
selected.
The "Handling Err. Per Fdr" tab sheet is divided further into several tabs and
each tab sheet shows the handling errors per feeder on each individual feeder
bases.
When each tab is pressed, the corresponding tab sheet appears.
(1) Feeder No.
Shown are the feeder Nos.
(2) Total Components
Each text box shows the total number of picked components (number of
pickup actions) for each individual feeders.
(3) A: comp. Missing
Each text box shows the total number of missing components detected
by the linear measure detection sensor for each individual feeders.
(4) B: comp. Missing
Each text box shows the total number of missing components detected
through recognition operation for each individual feeders.
0606-009
2.3 Handling Errors Per Feeder

5-17
AIVEDT-ID
(5) C: comp. Vertical
Each text box shows the total number of vertical component errors
detected by the linear measure detection sensor for each individual
feeders.
(6) D: comp. Recog.
Each text box shows the total number of errors detected through
recognition operation for each individual feeders.
(7) E: comp. Thick
Each text box shows the total number of errors in component thickness
detected by the linear measure detection sensor for each individual
feeders.
(8) F: pick-up Dif
f
Each text box shows the total number of pickup difference errors
detected in the recognition process for each individual feeders.
(9)
G: comp. Posture
Each text box shows the total number of reversed component and
polarity judgment errors detected in the recognition process for each
individual feeders.
(10) Total Errors
Each text box shows the total number of errors detected in (3) through
(9).
(11)
Rate of Error (%)
Each text box shows the percentage of the total number of errors per the
number of picked components.
(12) Shrtg. of Comp.
Each text box shows the total number of component shortage errors
detected for each individual feeders.
Note
When one of the above buttons is pressed, the feeder No. with the biggest
parameter under the selected button is displayed in the first line and feeder
Nos. having the subsequent (second, third, fourth, ...) biggest parameters
follow.
That is, parameters are re-arranged in order of error counts, making it easy
to analyze and improve production rate.
When the [Feeder No.] button is pressed, the feeder Nos. are re-arranged
in their initial order (order of slot Nos.).
0606-009
2.3 Handling Errors Per Feeder
5-18
AIVEDT-ID
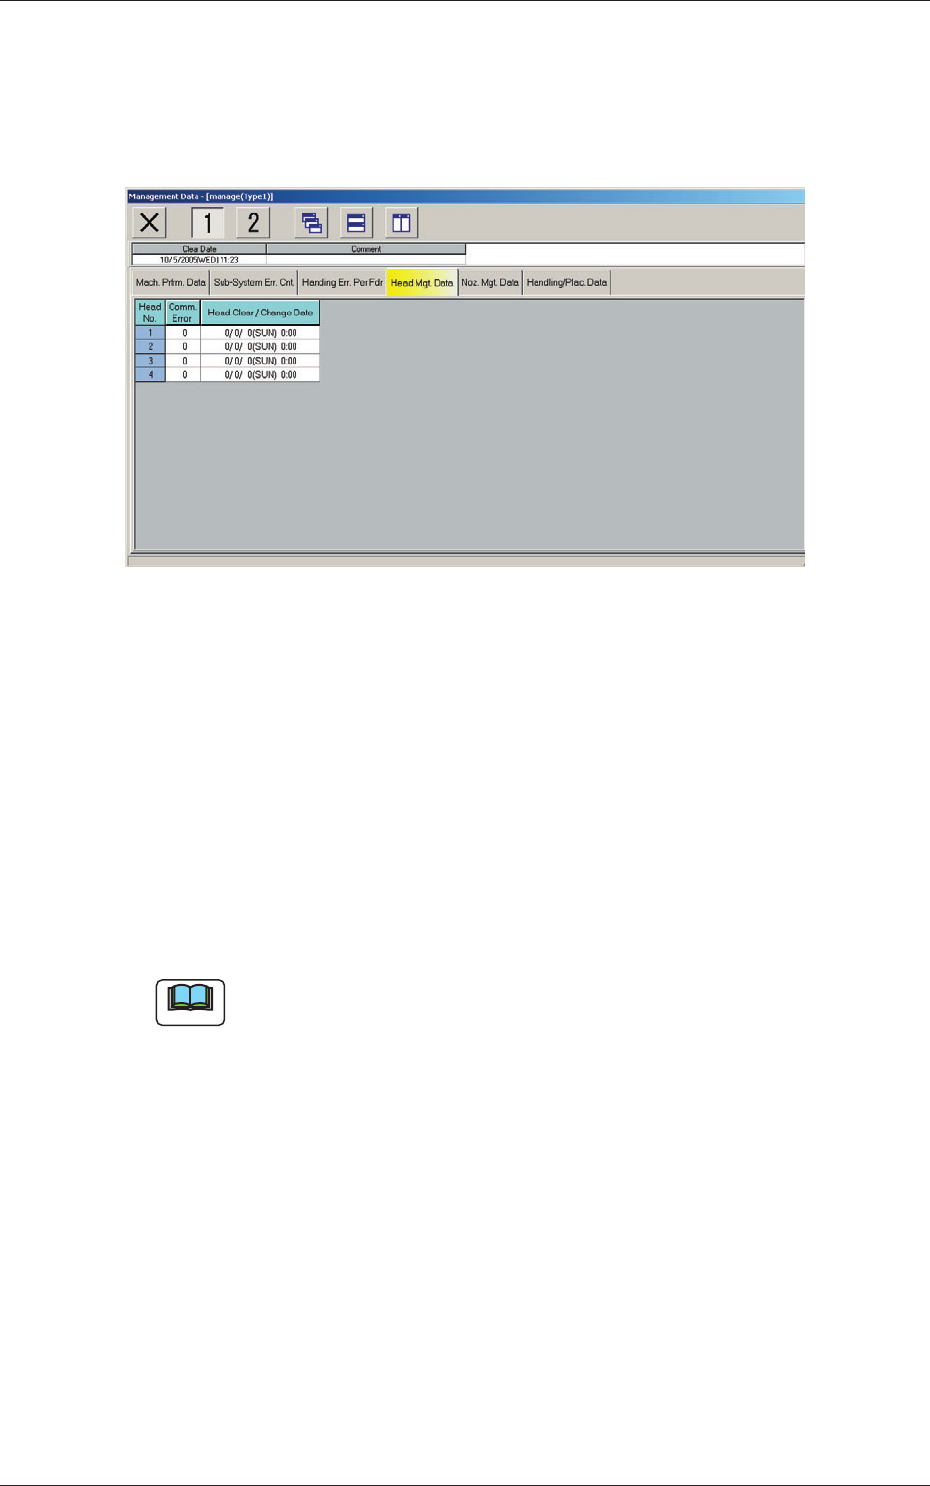
2.4 Head Management Data
When the "Head Mgt. Data" tab is pressed in the "Management Data"
window, the following tab sheet appears.
Fig. 3E9 "Head Mgt. Data" Tab Sheet
The tab sheet enables the operator to view the head management data.
(1) Head No.
Displayed are the head Nos. (1, 2, 3, and 4).
(2) Comm. Error
Shown is the number of communication errors for each head.
(3)
Head Clear/Change Date
Shown are the updated dates for each head.
Note
When one of the above buttons is pressed, the head No. with the biggest
parameter under the selected button is displayed in the first line and head
Nos. having the subsequent (second, third, fourth) biggest parameters
follow.
That is, parameters are re-arranged in order of error counts, making it easy
to analyze and improve production rate.
When the [Head No.] button is pressed, the head Nos. are re-arranged in
their initial order (order of head Nos.).
0606-009
2.4 Head Management Data