3OM-1208-011_w.pdf - 第213页
5-26 AIVEDT -ID 3.2 Machine Performance Data When the "Machine Performance Data" tab is pressed in the "Pattern Program Management Data" window , the following tab sheet appears inside the window . Fi…
5-25
AIVEDT-ID
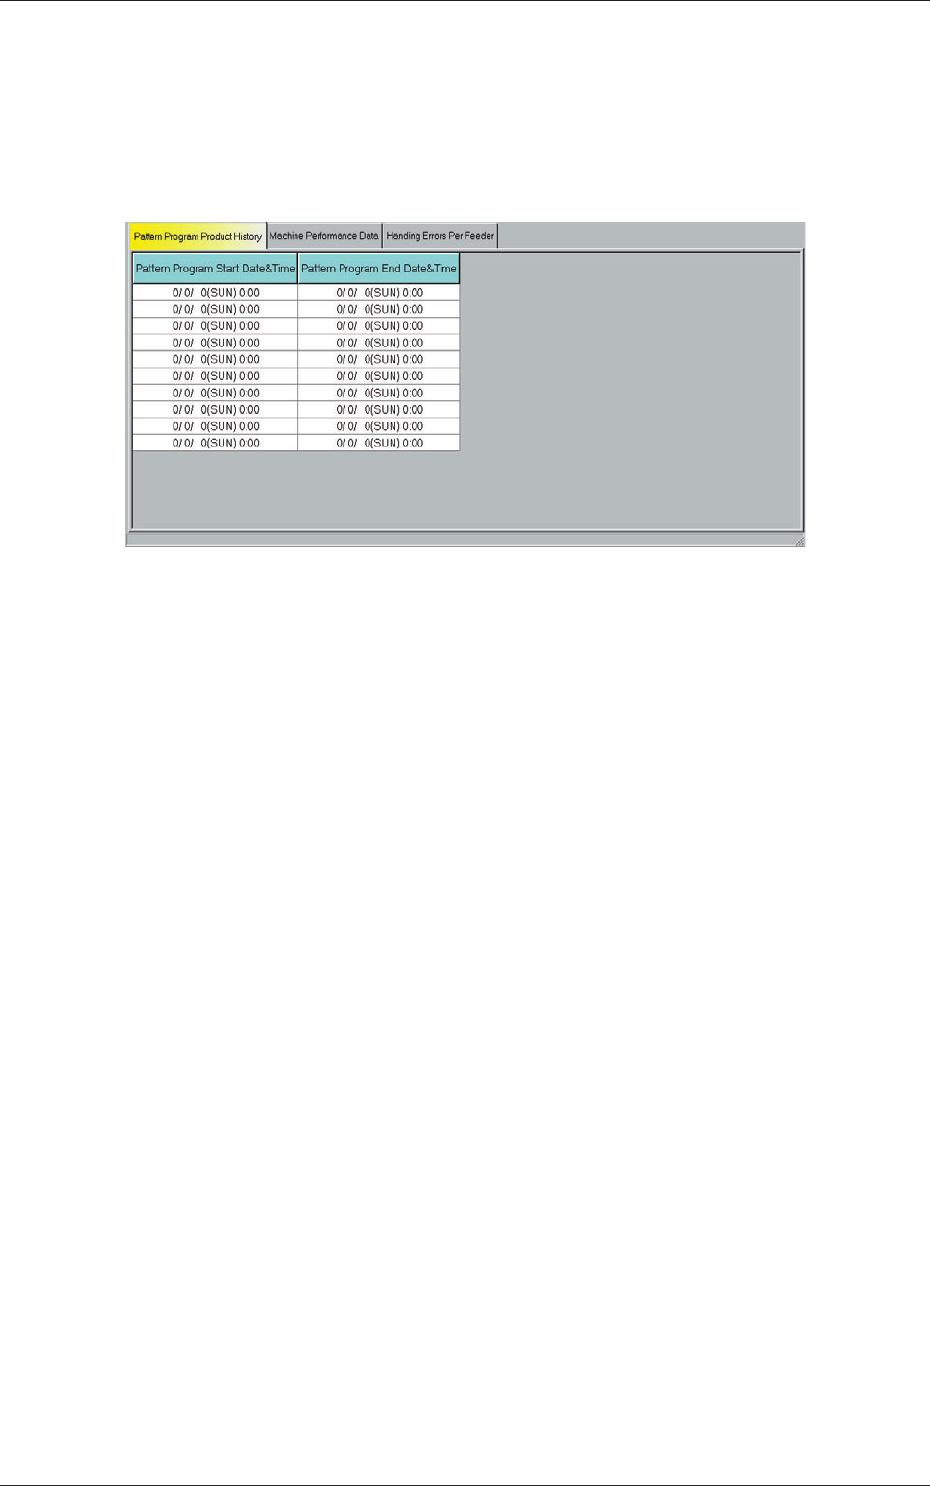
3.1 Pattern Program Product History
When the "Pattern Program Product History" tab is pressed in the "Pattern
Program management Data" window, the following tab sheet appears inside
the window.
Fig. 3E13 "Pattern Program Product History" Tab Sheet
Up to 10 records (logs that show the number of times specified as current
pattern program) are displayed for each individual pattern programs.
The start and end date & time records (logs) are also displayed for the
selected pattern program.
When there are more than 10 logs, the older ones are deleted one by one.
3.1 Pattern Program Product History
0606-009
5-26
AIVEDT-ID
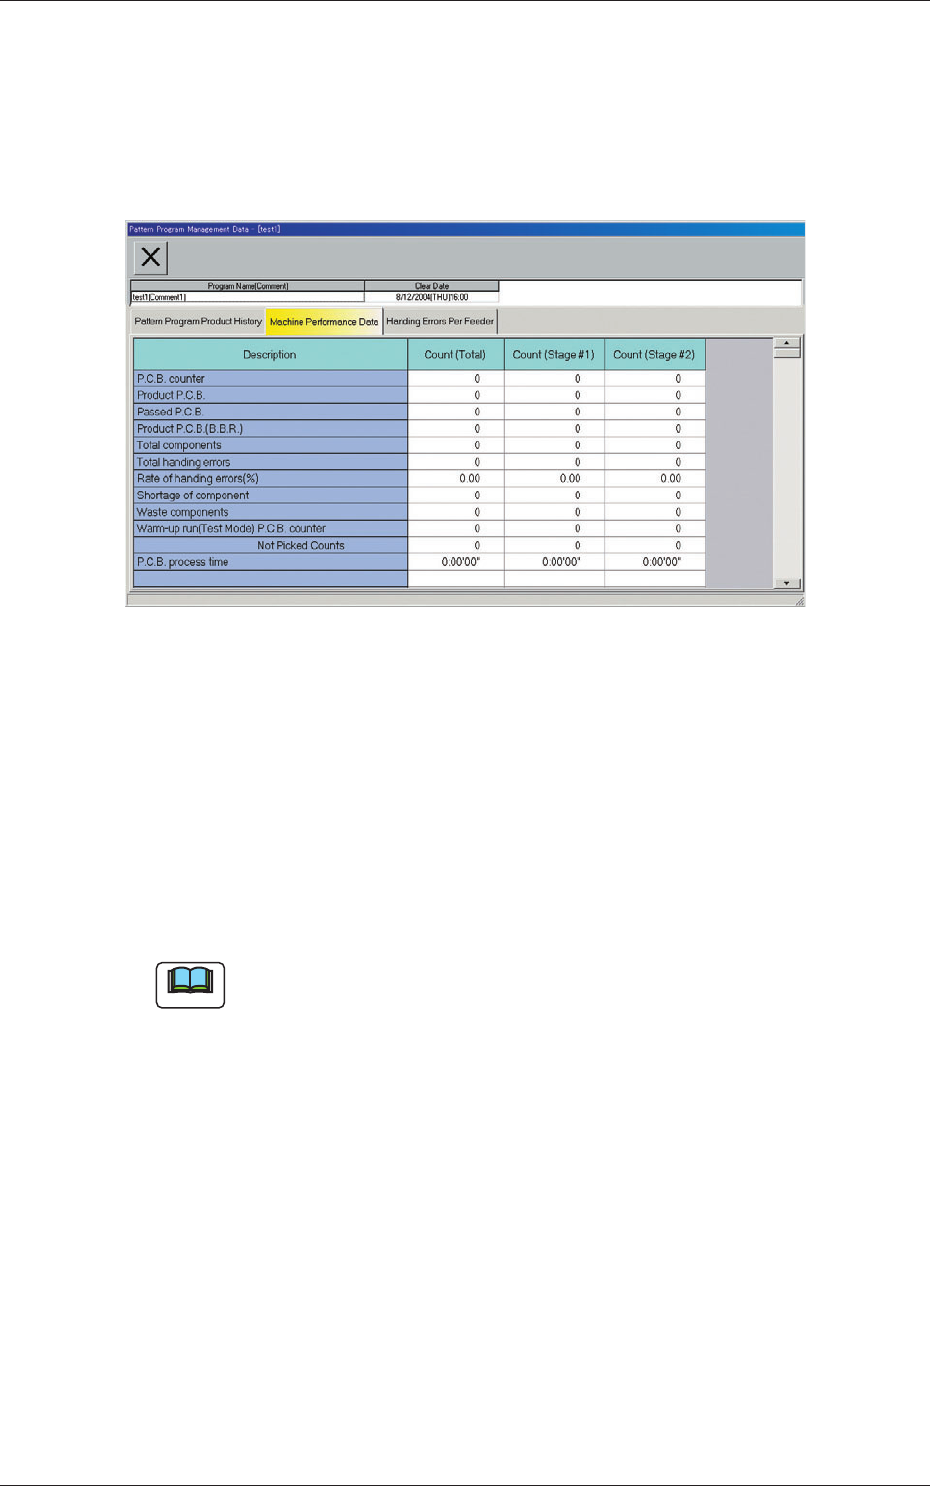
3.2 Machine Performance Data
When the "Machine Performance Data" tab is pressed in the "Pattern
Program Management Data" window, the following tab sheet appears inside
the window.
Fig. 3E14 "Machine Performance Data" Tab Sheet
A list of management data (the counted numbers (total counts included)
related to "Stage #1" and "Stage #2" for the current program (model)) is
displayed for each pattern program.
(1) PCB counter
Shown is the number of produced PCBs.
Counting is implemented when the X/Y table is zeroed after component
placement operation (when a PCB is fi
nished).
Note
When a particular pattern program is set several times as current one, the
sum total is computed.
(2) Product PCB
The number of produced unit PCBs on multi-unit PCB is summed up.
Counting is implemented when the X/Y beam is zeroed after component
placement operation (when a unit is finished).
When the bad board reject (BBR) function (option) is used, defective
unit PCBs are excluded.
3.2 Machine Performance Data
0606-009
5-27
AIVEDT-ID
3.2 Machine Performance Data
0606-009
(3) Passed PCB
The number of passed PCBs is counted when the machine is set in the
"PASS" mode.
Counting is implemented when the PCB transfer starts (when the PCB
on the PCB positioning section is transferred to the output conveyor).
(4) Product PCB (BBR)
Shown is the number of defective PCBs summed up when the bad
board reject function (option) is used.
(5) Total components
Shown is the number of picked components (the number of pickup
operations).
(6) T
otal handling errors
Shown is the total number of component handling errors.
(7) Rate of handling errors (%)
Shown is the percentage of handling errors per total number of picked
components.
(8) Shortage of component
Shown is the total number of detected component shortage errors.
(9) Waste components
Shown is the total number of components that were picked up but not
placed.
Note
The indicated number of components represents the components that
were not placed due to a vertical component error (sensor), a component
recognition error, a component thickness error, interrupted production, the
detection (Unit PCB BBR Mode: Option) of a defective unit PCB., etc.