TR7500E_Manual_en_v28 - 第119页
C h a p t e r 2 M a nu a l B a r i n t r o d u ce T R 7500 U S E R M A N U AL 1 12 C ou n t T h e n u m b e r o f d a t a c a l c u l a t e d . X _ M a x T h e m a x i mum f o r X - s h i f t ( u n i t : m m ) Y _ M a x …
Chapter 2 Manual Bar introduce
TR7500 USER MANUAL
111
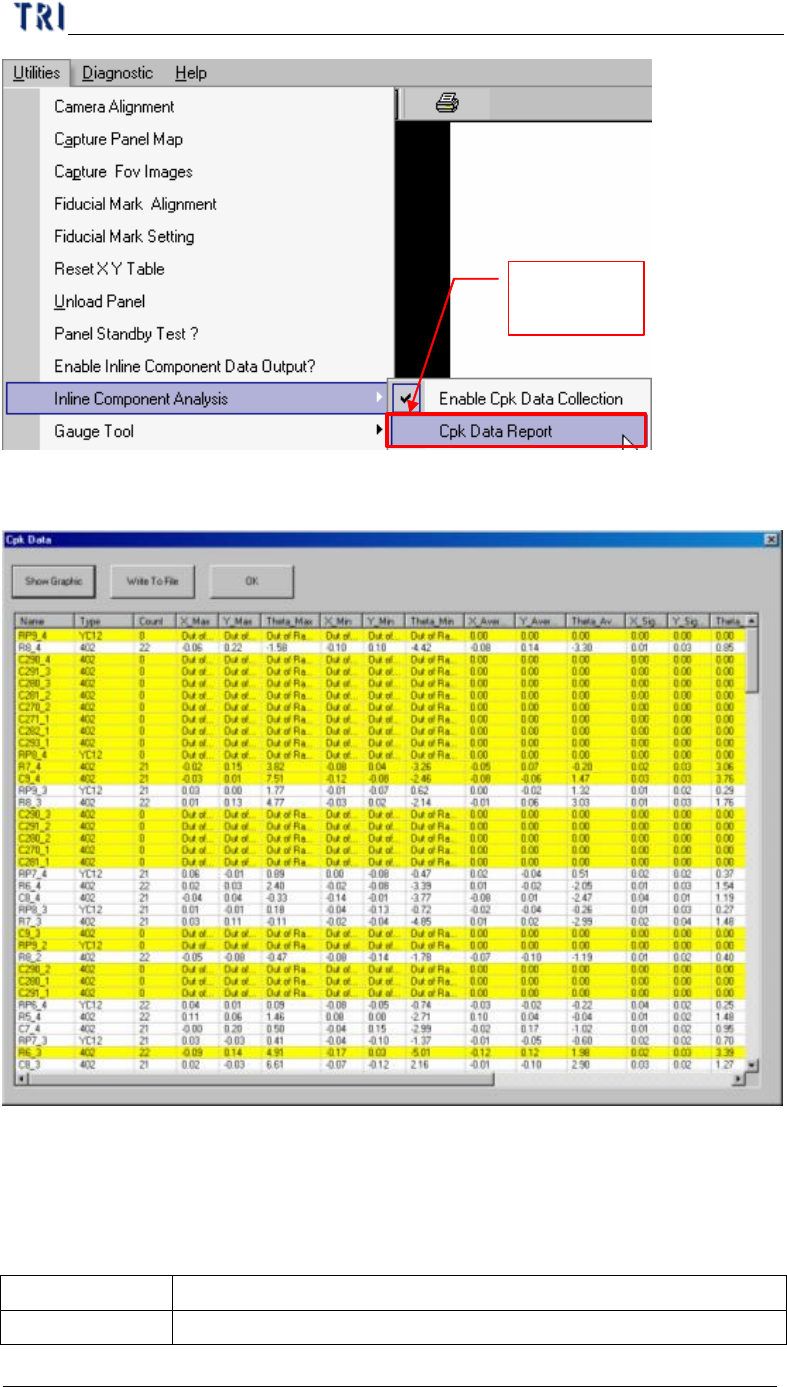
Change to
enable
l Cpk format
n You can click on the field title to sequence the data according to the value.
n The yellow means that the component is abnormal. (The Cpk value is lower
than CpkSpc)
n Every field is explained as follows:
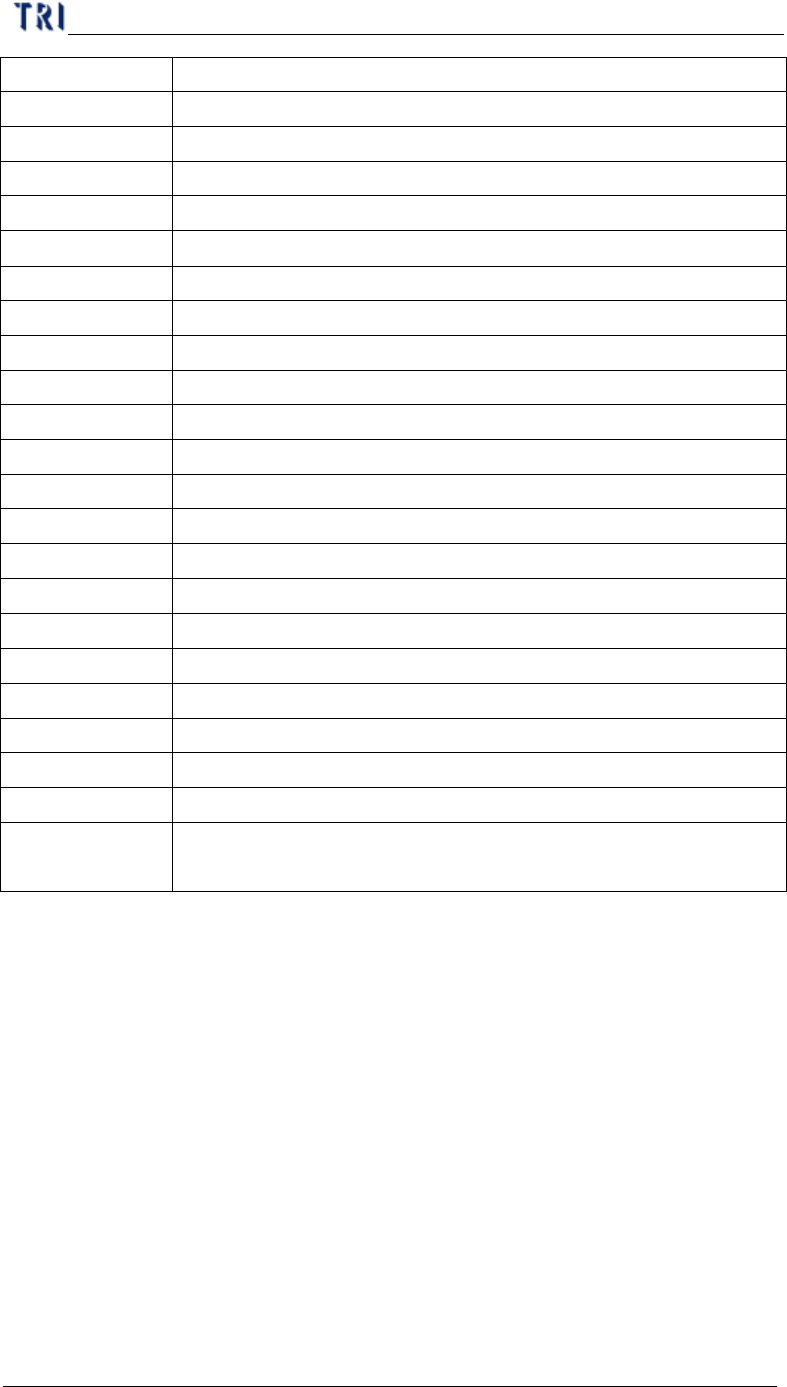
Name Component name
Type Component type
Chapter 2 Manual Bar introduce
TR7500 USER MANUAL
112
Count The number of data calculated.
X_Max The maximum for X-shift (unit: mm)
Y_Max The maximum for Y-shift (unit: mm)
Theta_Max The maximum for Theta (unit: mm)
X_Min The minimum for X-shift (unit: mm)
Y_Min The minimum for Y-shift (unit: mm)
Theta_Min The minimum for Theta (unit: mm)
X_Average The average for X-shift (unit: mm)
Y_Average The average for Y-shift (unit: mm)
Theta_Average The average for Theta (unit: mm)
X_Sigma The sigma for X-shift (unit: mm)
Y_Sigma The sigma for Y-shift (unit: mm)
Theta_Sigma The sigma for Theta (unit: mm)
X_CpkSpec CpkSpec for X-shift
X_Cpk Cpk for X-shift
Y_CpkSpec CpkSpec for Y-shift
Y_Cpk Cpk for Y-shift
Theta_CpkSpec CpkSpec for Theta
Theta_Cpk Cpk for Theta
Missing The number of missing.
X_Position The result of X coordinate on CAD adds the average of X-shift
Y_Position The result of Y coordinate on CAD adds the average of Y-shift
Status It shows [NG] and displays yellow symbol when there’s a
[Missing] or [Cpk<CpkSpec]. Otherwise it shows [OK].
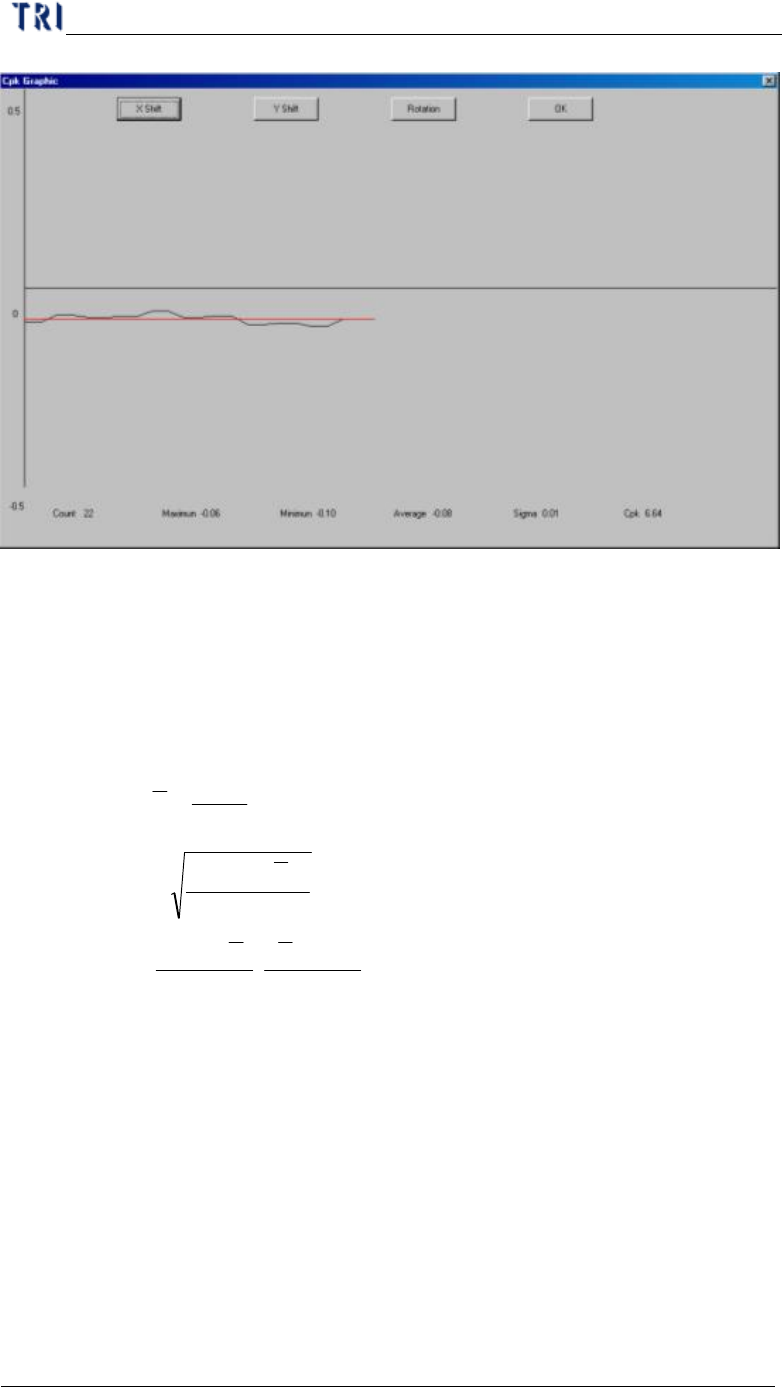
n Show Graphic – Show the time sequence graph for selected component.
Ø You can select to display the graph of X-shift, Y-shift or Rotation.
Ø The horizontal axis presents the count and the vertical means the
result.
Ø The red line means the average.
Chapter 2 Manual Bar introduce
TR7500 USER MANUAL
113
n Write To File – Output the original data as text file.
n OK – Close the window.
7.9.3. Formula
l
i
X=Result
l
n
=
countTest
l
n
X
∑
==
i
X
Average
l
1
)(
Sigma
2
−
−
==
∑
n
XX
i
σ
l
−−
=
σσ 3
)(
,
3
)( LSLXXUSL
MinC
pk
l USL and LSL present the upper spec limit and lower spec limit. You should set
the value when starting this function.
7.10. Gauge Tool