00197787-02_SI_SIPLACE_HeadVerification_EN.pdf - 第41页
6 Description of the test results 6.3 Air & vacuum with external sensor Software Manual SIPLACE Head Verification 03/2018 41 9 Zero deviation shows the difference between Median Air external and Air external: Zero de…
6 Description of the test results
6.3 Air & vacuum with external sensor
40 Software Manual SIPLACE Head Verification 03/2018
6.3 Air & vacuum with external sensor
6.3.1 Measurement principle
This measurement is used to determine the vacuum and air blast quality of the placement head
and its segments by an external sensor. Several tests are performed to verify the different aspects
of the vacuum system, and also to compare the achieved results with the results that are achieved
from the test with the internal sensor.
1. The vacuum is measured with the internal sensor and the segment closed, and then with the
segment open at the external sensor.
2. Finally, the air blast is activated and measured with the internal sensor, and then with the seg-
ment at the external sensor.
6.3.2 Measurement result
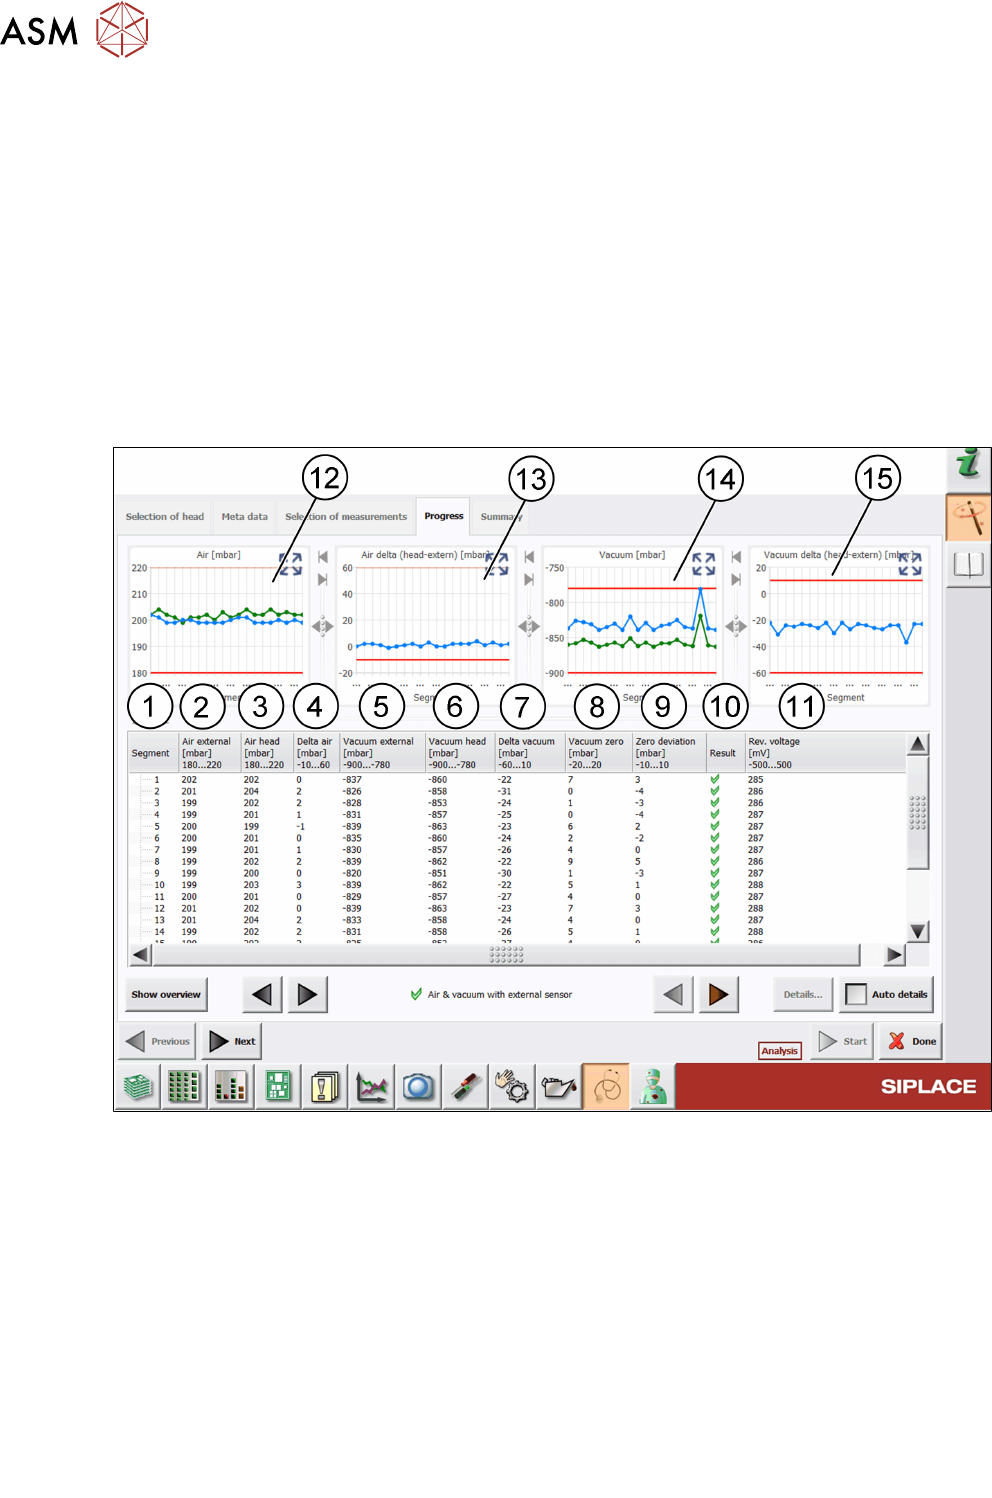
Fig.35: Result view – Air & vacuum with external sensor
1 Measured Segment
2 Values of the Air external measurement using the external sensor.
3 Values of the Air head measurement using the internal sensor.
4 Delta air shows the difference between Air external and Air head:
Delta air = Air head - Air external
5 Values of the Vacuum external measurement using the external sensor.
6 Values of the Vacuum head measurement using the internal sensor.
7 Delta vacuum shows the difference between Vacuum external and Vacuum head:
Delta vacuum = Vacuum head - Vacuum external
8 Vacuum zero shows the difference between Median
Vacuum external
and Vacuum external:
Vacuum zero = Median
Vacuum external
- Vacuum external
6 Description of the test results
6.3 Air & vacuum with external sensor
Software Manual SIPLACE Head Verification 03/2018 41
9 Zero deviation shows the difference between Median
Air external
and Air external:
Zero deviation = Median
Air external
- Air external
10 Result view indicating if the values are within (green tick) or outside (red cross) the limits.
11 Values of the Rev. voltage measurement show the reference voltage during the measure-
ment. Always check for a low reference voltage as otherwise this can limit the available
measurement range.
12 Graph showing the Air external (blue) and Air head (green) values for each segment.
13 Graph showing the Delta air values for each segment.
14 Graph showing the Vacuum external (blue) and Vacuum head (green) values for each
segment.
15 Graph showing the Delta vacuum values for each segment.
6.3.3 Interpretation of the results obtained
‘Vacuum head’ ok / ‘Vacuum external’ error for all segments
Cause Solution
External vacuum filter defective ► Check / exchange the external sensor.
‘Vacuum head’ ok / ‘Vacuum external’ error for individual segments
Cause Solution
Sealing damaged / poor air-tightness at the
nozzle seating
► Replace the filter disks.
Nozzle worn or damaged ► Replace the nozzle.
Vacuum hose to the affected segment polluted
or damaged
► Replace the vacuum hose.
Holding circuit polluted ► Maintain or clean the holding circuit in an
ultrasound bath.
6 Description of the test results
6.4 Anti-glare shield mounting
42 Software Manual SIPLACE Head Verification 03/2018
6.4 Anti-glare shield mounting
6.4.1 Measurement principle
The anti-glare shields are a key part of the C&P20A head, required to trigger the Z-axis bottom
light barrier. The measurement checks the correct mounting and the condition of the anti-glare
shields.
During the measurement, all segments are rotated in increments of 90° while, at the same time, the
Z-axis bottom light barrier voltage is measured. If an anti-glare shield is not mounted properly,
damaged or polluted, the voltage signal will drop immediately.
6.4.2 Measurement result
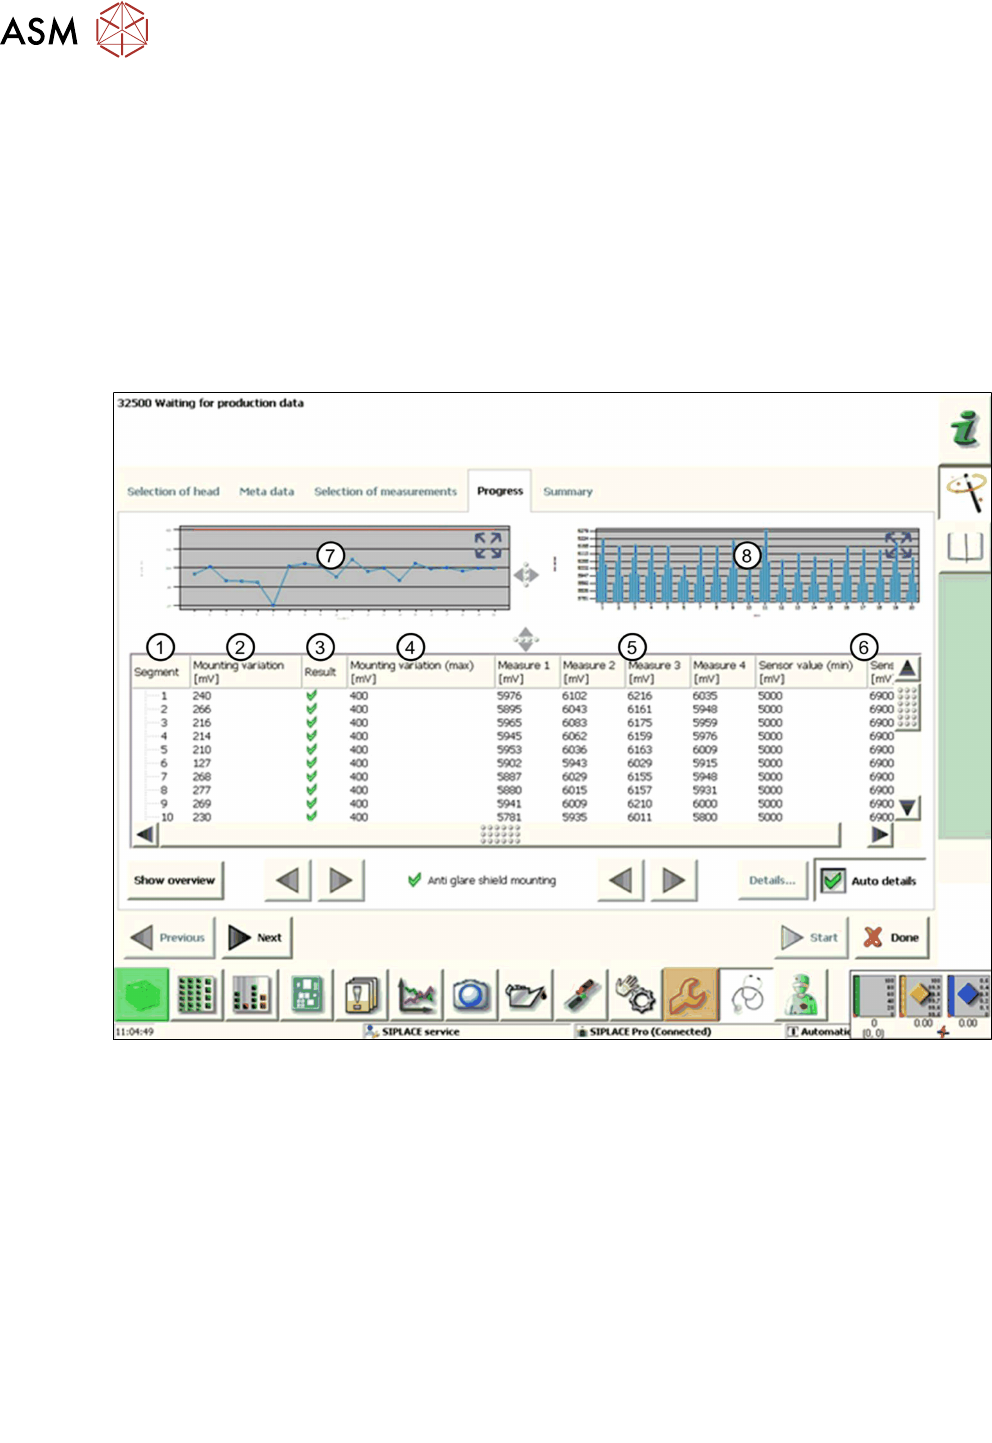
Fig.36: Result view – Anti-glare shield mounting
1 Measured Segment
2 The Mounting variation describes the eccentricity (rotation) of the anti-glare shield to the
central axis of the segment and is calculated from measure 1-4:
Mountingvariation = Measure1-4(max) – Measure1-4(min)
3 Result view indicates if the values measured are within (green tick) or outside (red cross)
the limits.
4 Mountingvariation(max) is the max. limit allowed for the mounting variation.
5 Analog voltage determined for each segment at 0°, 90°, 180° and 270° (Measure1-4).
6 The Sensorvalue(max/min) defines the limits for the four measured values (Measure
1-4).
7 Graph showing the Mounting variation.
8 Graph showing the values measured at 0°, 90°, 180° and 270° (Measure 1-4).