00197787-02_SI_SIPLACE_HeadVerification_EN.pdf - 第62页
6 Description of the test results 6.14 Head endurance run 01005 62 Software Manual SIPLACE Head Verification 03/2018 6.14.3 Interpretation of the results obtained ‘Z down delta pick’ and ‘Z down delta place’ errors for a…
6 Description of the test results
6.14 Head endurance run 01005
Software Manual SIPLACE Head Verification 03/2018 61
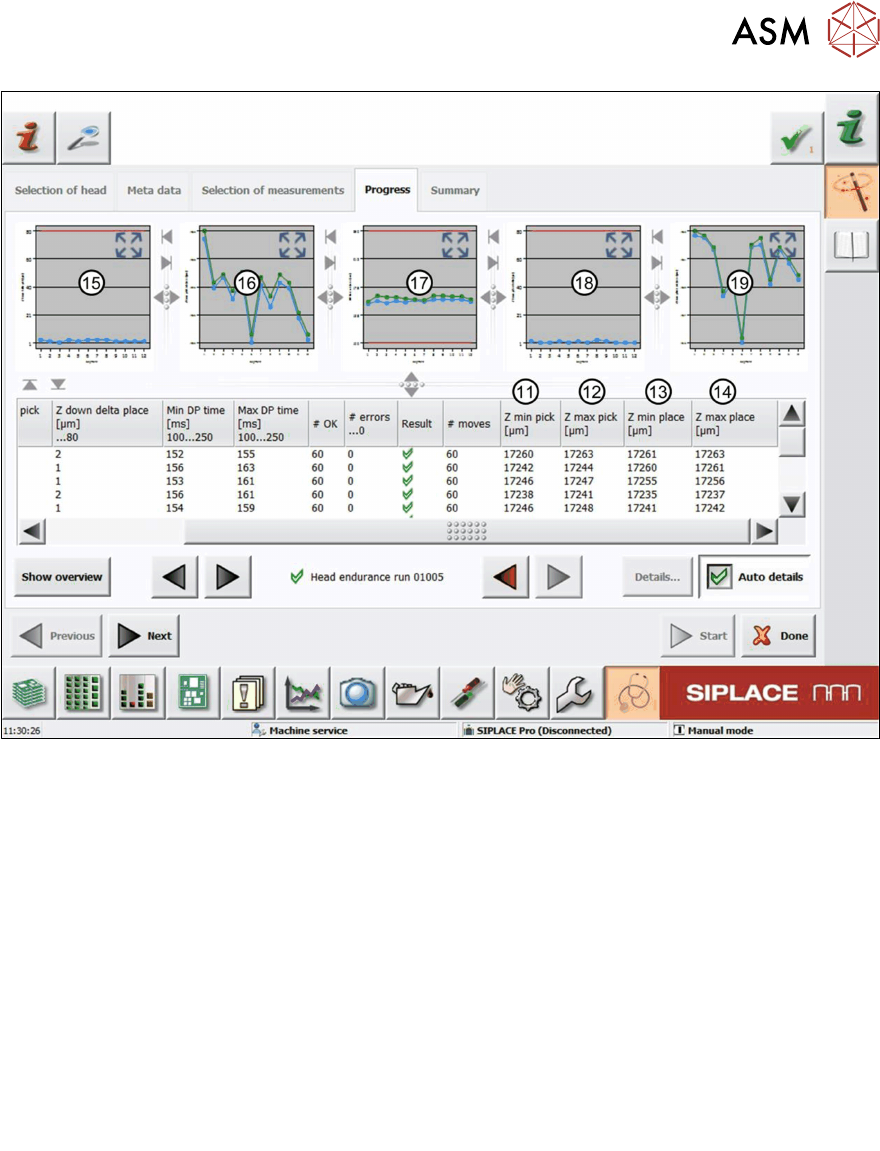
Fig.47: Result view – Head endurance run 01005 2/2
11 Zminpick is the smallest z-pick value determined.
12 Zmaxpick is the largest z-pick value determined.
13 Zminplace is the smallest z-place value determined.
14 Zmaxplace is the largest z-place value determined.
15 Graph showing the Zdowndeltapick values for each segment.
16 Graph showing the Zdowndeltapickmin(blue) and Zdowndeltapickmax(green) val-
ues for each segment.
17 Graph showing the DPtimemin(blue) and DPtimemax (green) values for each seg-
ment.
18 Graph showing the Zdowndeltaplace values for each segment.
19 Graph showing the Zdowndeltaplacemin (blue) and Zdowndeltaplacemax (green)
values for each segment.
6 Description of the test results
6.14 Head endurance run 01005
62 Software Manual SIPLACE Head Verification 03/2018
6.14.3 Interpretation of the results obtained
‘Z down delta pick’ and ‘Z down delta place’ errors for all segments
Cause Solution
Z-motor defective ► Replace the Z-motor.
Z-motor linear guide not moving smoothly ► Replace the Z-motor.
Read unit of Z-motor polluted ► Clean the read unit of the Z-motor.
‘Z down delta pick’ and ‘Z down delta place’ errors for individual segments
Cause Solution
DP linear guide not moving smoothly ► Replace the DP unit.
Linear guide of segment not moving smoothly ► Replace the linear guide of the segment.
‘Min DP time’ or ‘Max DP time’ errors for individual segments
Cause Solution
Internal segment (DP) problem ► Replace the segment (DP).
6 Description of the test results
6.15 Head endurance run 2N
Software Manual SIPLACE Head Verification 03/2018 63
6.15 Head endurance run 2N
6.15.1 Measurement principle
The Head endurance run measurement checks the reliability of the D-axis and the Z-axis for the
standard range of components which are typically processed using the standard placement para-
meter.
When the Z-axis is verified, the segment is moved up and down several times to determine the
characteristics during the upward and downward movement. Before each downward movement,
the D-axis is turned by 180° and the time is measured that it takes to reach the target position.
6.15.2 Measurement result
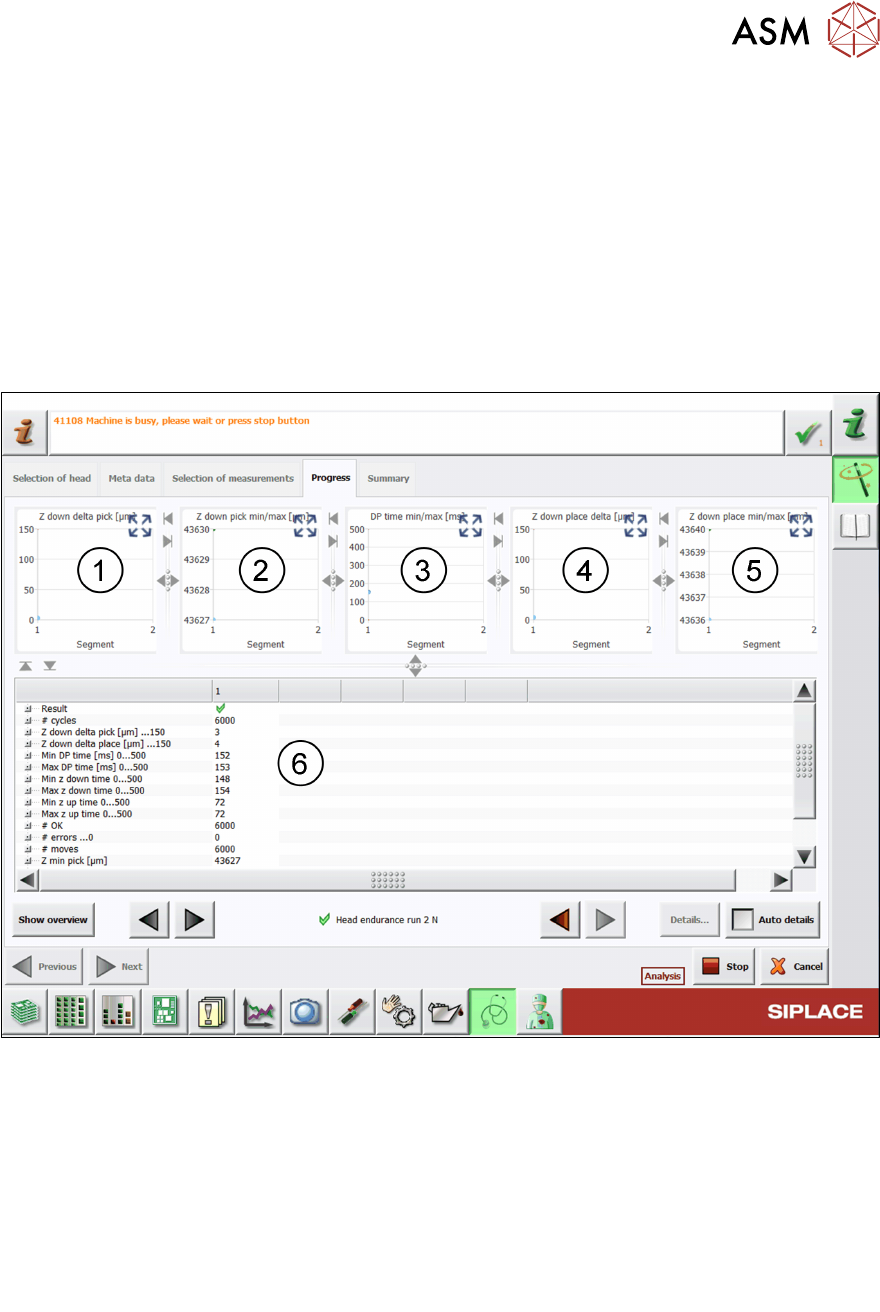
Fig.48: Result view – Head endurance run 2 N
1 Graph showing the Z down delta pick values for each segment.
2 Graph showing the Z down pick min (blue) and Z down pick max (green) values for each
segment.
3 Graph showing the DP time min (blue) and DP time max (green) values for each seg-
ment.
4 Graph showing the Z down delta place values for each segment.
5 Graph showing the Z down place min (blue) and Z down place max (green) values for
each segment.