00197787-02_SI_SIPLACE_HeadVerification_EN.pdf - 第80页
6 Description of the test results 6.21 Segment offset up (SOO) 80 Software Manual SIPLACE Head Verification 03/2018 6.21.3 Interpretation of the results obtained ‘Up X’ and ‘Up Y’ error for all segments Cause Solution In…
6 Description of the test results
6.21 Segment offset up (SOO)
Software Manual SIPLACE Head Verification 03/2018 79
6.21.2 Measurement result
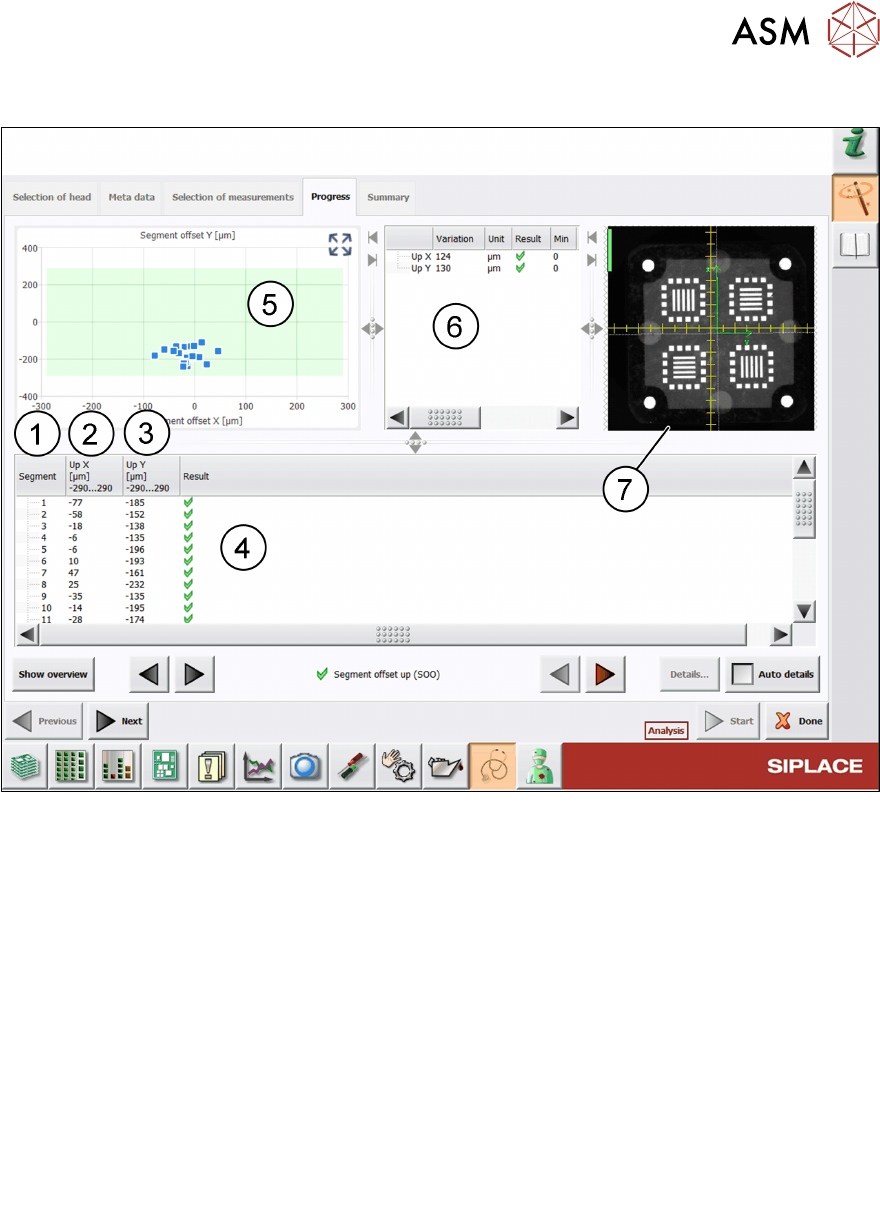
Fig.55: Result view – Segment offset up (SOO)
1 Measured Segment
2 Up X shows the mean value of the 4 Up X measurements at different angles.
Up X
Segment(n)
= Mean Up X
Segment(n0°, n90°, n180°, n270°)
3 Up Y shows the mean value of the 4 Up Y measurements at different angles.
Up Y
Segment (n)
= Mean Up Y
Segment (n0°, n90°, n180°, n270°)
4 Result view indicating if the values are within (green tick) or outside (red cross) the limits.
5 Graph showing the Up X and Up Y values for each segment.
6
●
Variation Up X shows the mean value of all Up X values.
●
Variation Up X = Mean
UPx(n)
●
Variation Up Y shows the mean value of all Up Y values.
●
Variation Up Y = Mean
UPx(n)
7 Live image of the calibration tool being measured.

6 Description of the test results
6.21 Segment offset up (SOO)
80 Software Manual SIPLACE Head Verification 03/2018
6.21.3 Interpretation of the results obtained
‘Up X’ and ‘Up Y’ error for all segments
Cause Solution
Incorrect zero point correction of the star ► Check the zero point correction of the star.
Component sensor defective or polluted ► Clean or replace the component sensor.
‘Up X’, ‘Up Y’, ‘Down X’ and ‘Down Y’ error for individual segments
Cause Solution
Segment bent, possibly after crash ► Replace the segment (DP).
Linear bearing of segment defective ► Replace the linear bearing (DP).
6 Description of the test results
6.22 Z-axis movement
Software Manual SIPLACE Head Verification 03/2018 81
6.22 Z-axis movement
6.22.1 Measurement principle
The Z-axis movement measurement determines the maximum travel range for each segment and
indicates the condition of the segment and Z-axis linear guide.
●
The Z-axis is moved three times into a free space until the hardware stop is reached or the Z-
axis current sensor is triggered. If the Z-axis moves easily to the hardware end stop, the linear
guides of both the segment and the Z-axis are in a good condition.
●
If the current sensor is triggered and the Z-axis is not moving smoothly, this is an indicator for
a mechanical problem with the segment and/or the Z-axis.
6.22.2 Measurement result
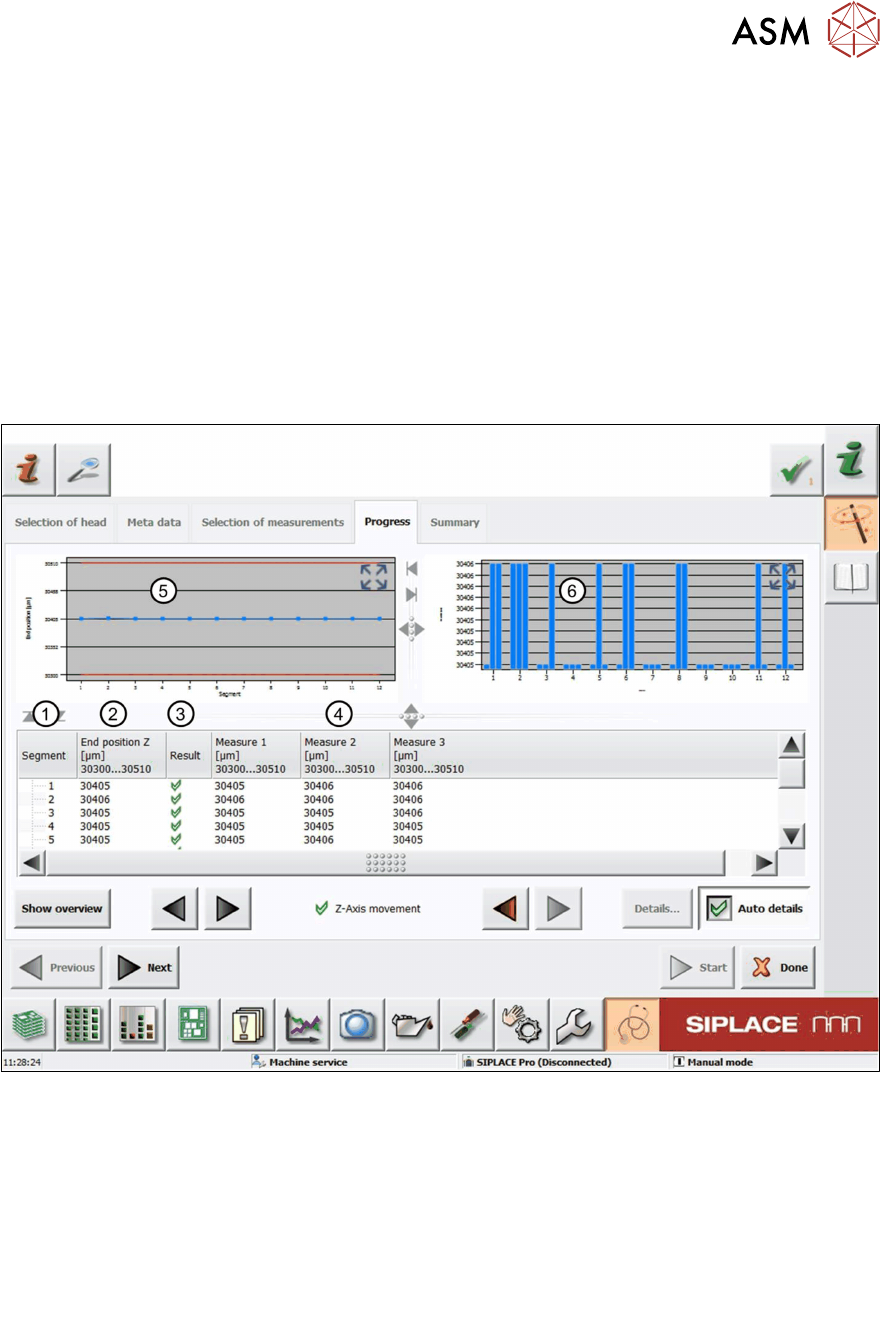
Fig.56: Result view – Z-axis movement measurement
1 Measured Segment
2 Calculated average travel range.
End position Z = mean value of Measure 1-3
3 Result view indicating if the values are within (green tick) or outside (red cross) the limits.
4 Measure 1-3 values measured from the three Z-axis movements per segment
5 Graph showing the calculated End position Z value for each segment.
6 Graph showing the Measure 1-3 values for each segment.