JO-116-001_w.pdf - 第78页
3-29 JO-1 16 6.2 Chart 6.2.2 Pitch Error The pitch-to-pitch errors are displayed, using the absolute values. Y ellow Line : X V alues Light Blue Line : Y V alues White Dashed Line : Mean of Absolute V alues Displayed fro…
3-28
JO-116
1105-001
6.2 Chart
6.2 Chart
There are four kinds of charts. The tabs in the "Chart" window can be used to
select a chart.
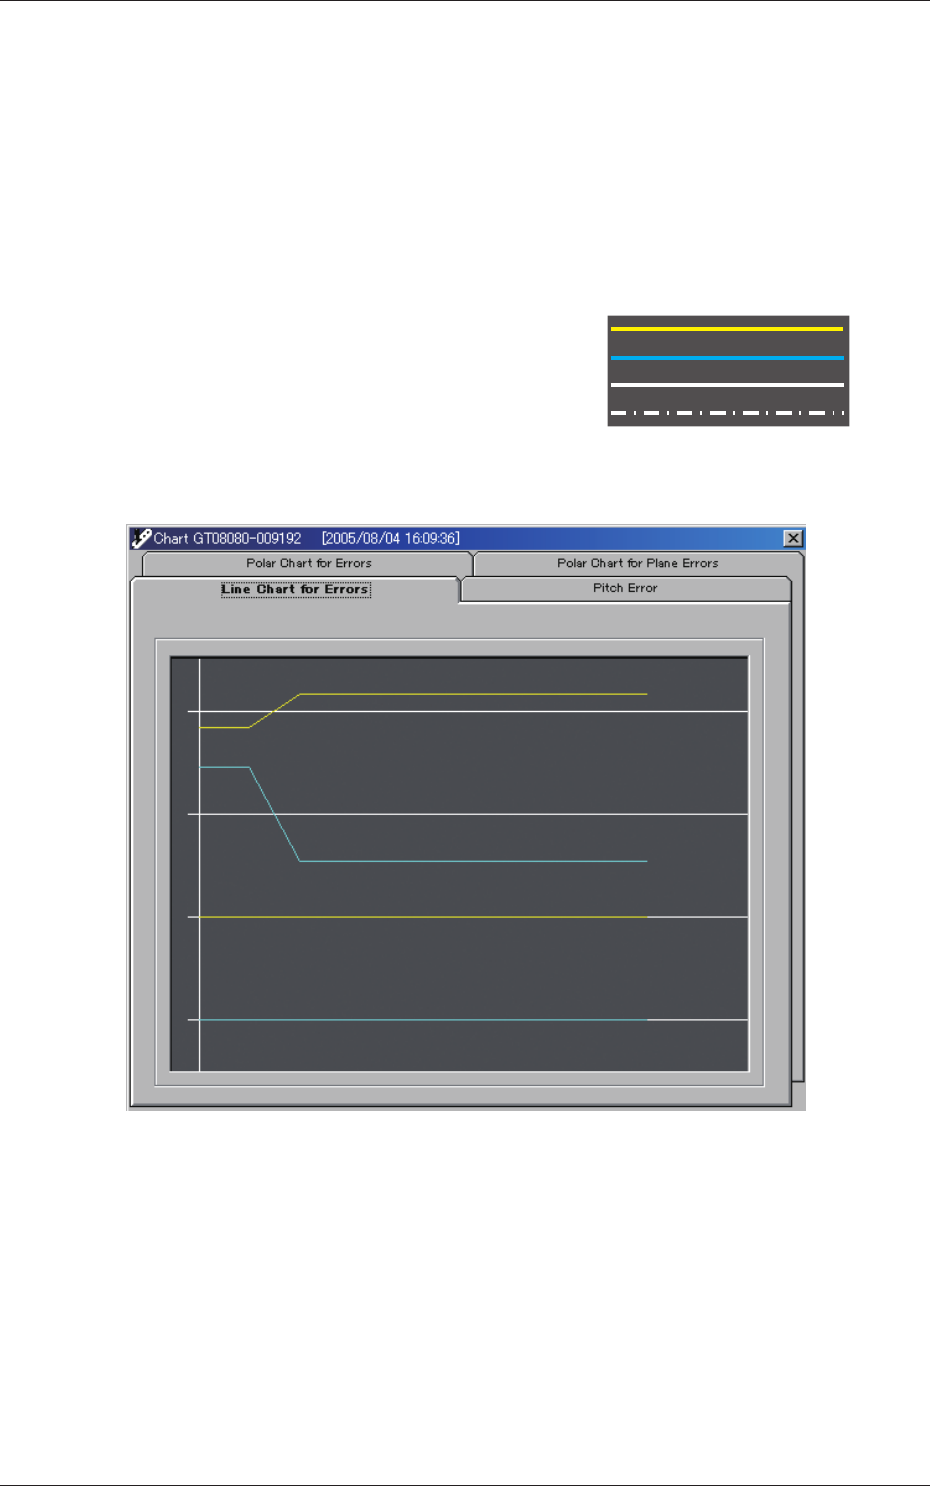
6.2.1 Line Chart for Errors
This line chart indicates the results of inspection for each individual
holes.
Yellow Line
: X Values
Light Blue Line
: Y Values
White Solid Line
: CENTER Values
White Dashed Line
: 0 Values
Displayed from the top are "X in Lane #1", "Y in Lane #1", "X in Lane
#2", and "Y in Lane #2".
Fig. C22
3-29
JO-116
6.2 Chart
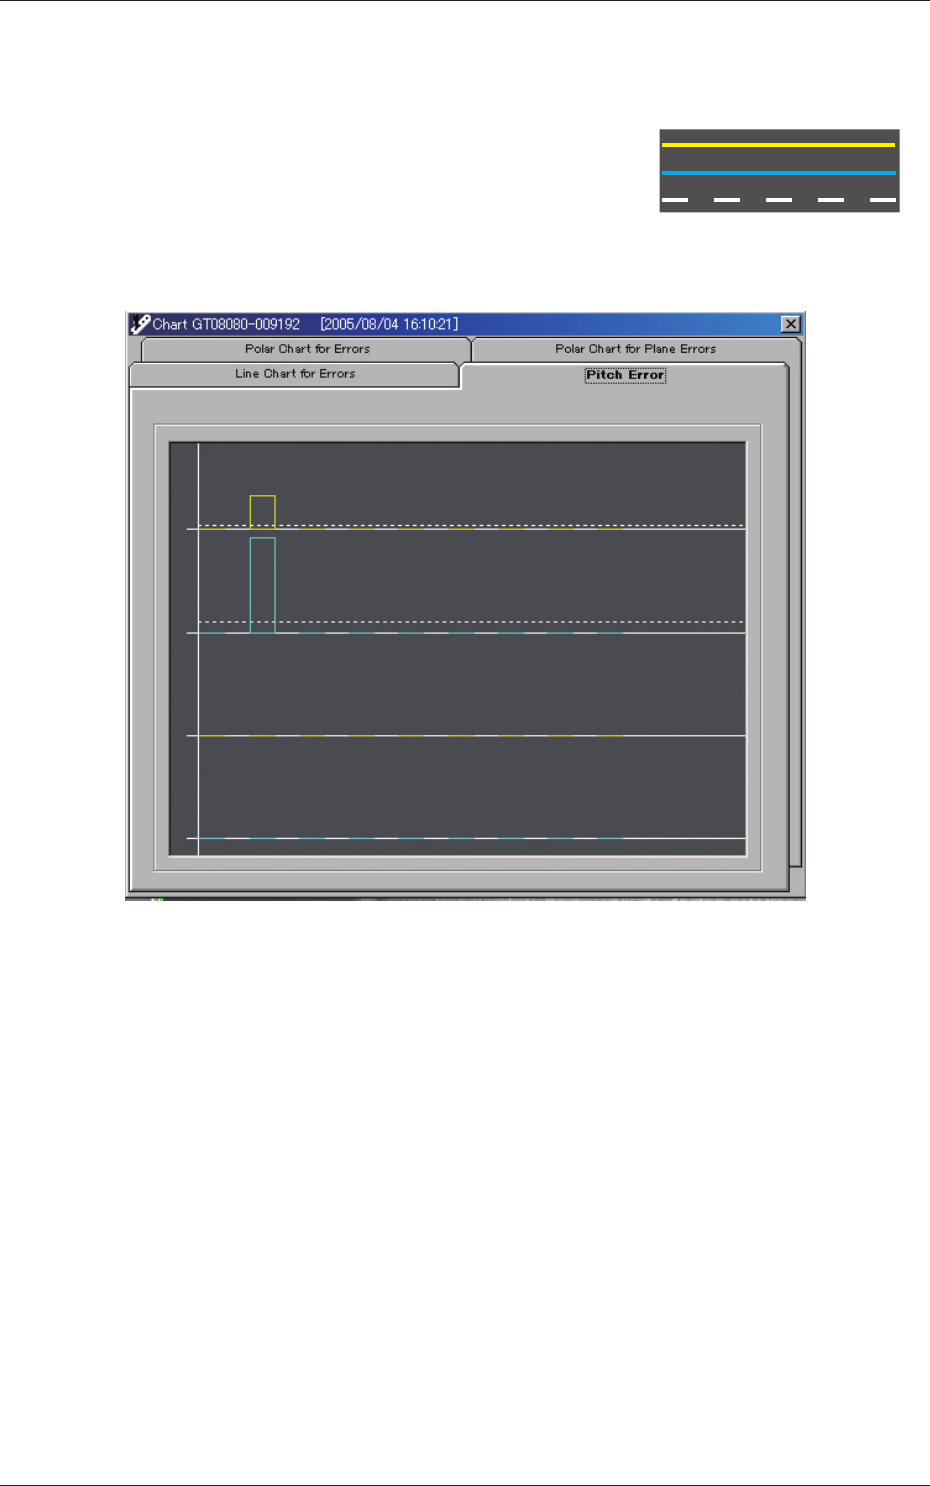
6.2.2 Pitch Error
The pitch-to-pitch errors are displayed, using the absolute values.
Yellow Line
: X Values
Light Blue Line
: Y Values
White Dashed Line
: Mean of Absolute Values
Displayed from the top are "X in Lane #1", "Y in Lane #1", "X in Lane
#2", and "Y in Lane #2".
Fig. C23
1105-001
3-30
JO-116
6.2 Chart
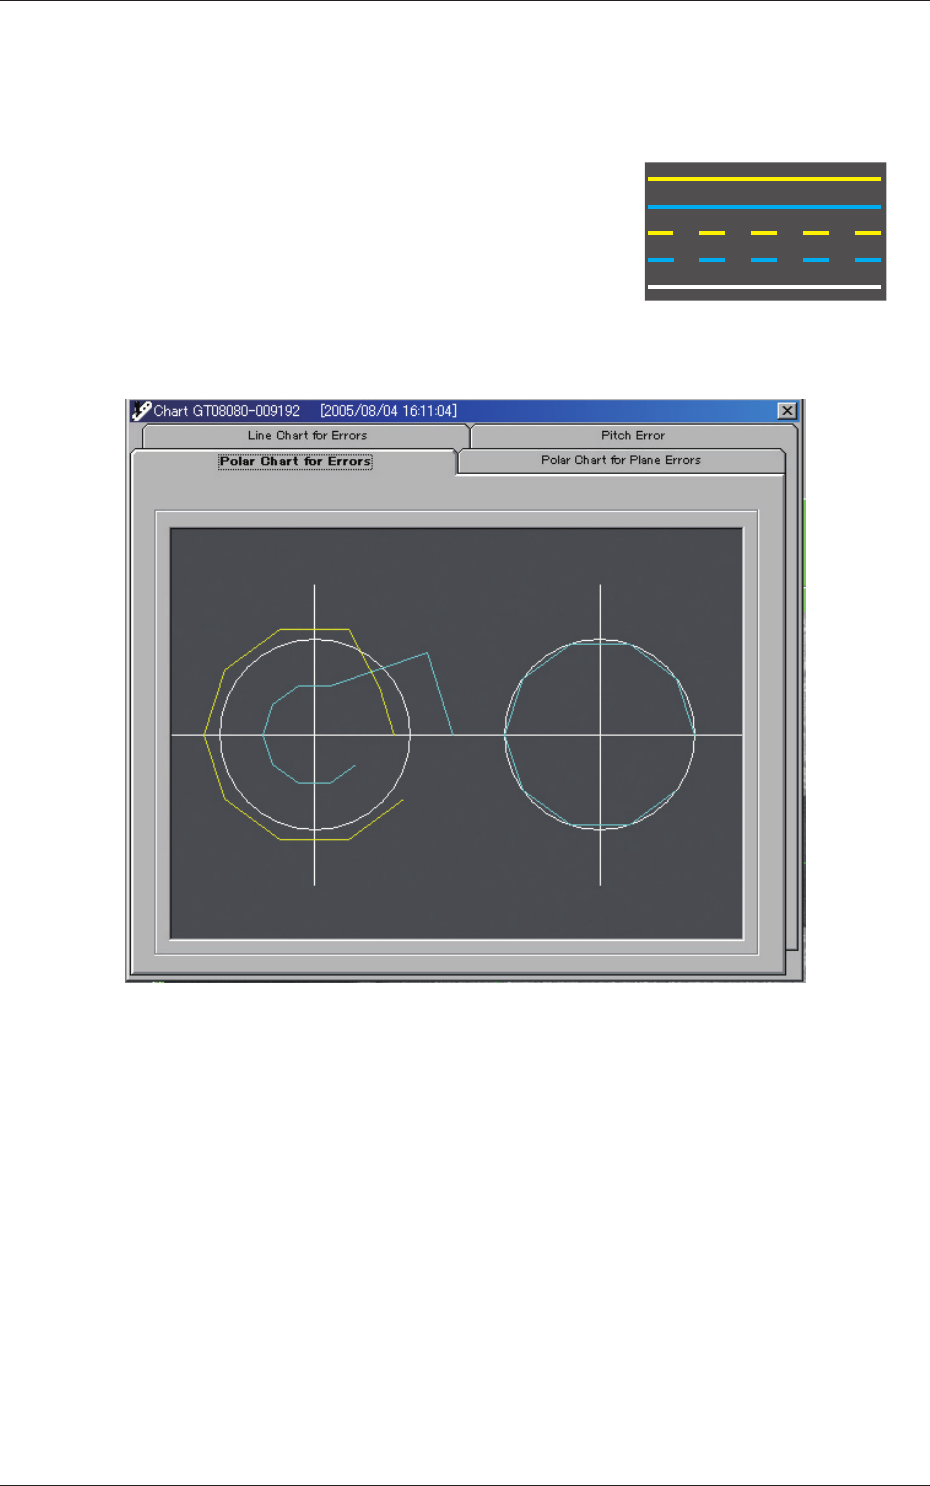
6.2.3 Polar Chart for Errors
The polar chart indicates the results of inspection performed at the
angular position of the sprocket.
Yellow Line
: X Values
Light Blue Line
: Y Values
Yellow Dashed Line
: X 0 Value
Light Blue Dashed Line
: Y 0 Value
White Solid Line
: CENTER Values
The errors in Lane #1 are displayed on the left side and the errors in Lane
#2 on the right side.
Fig. C24
1105-001