4OM-1011-002.pdf - 第60页
0305-001 Tg0860-PM-MM First Page P .C.B. COUNTER Shown is the number of produced P .C.B.’ s. Counting is implemented when the X/Y beam is zeroed after component placement operation (when a P .C.B. is finished). Note: Whe…
0305-001 Tg0860-PM-MM
(2) Machine Performance Data
Select the pattern program to be checked by pressing the corresponding
“NAMES (XX/XX)” key. When the [MACHINE PRFM. DATA] key is
pressed, the following display appears on the screen.
Every time the [NEXT PAGE] or the [PREV. PAGE] key is pressed, an-
other or previous page appears on the screen.
Fig. 4C7
First Page
Second Page
Fig. 4C8
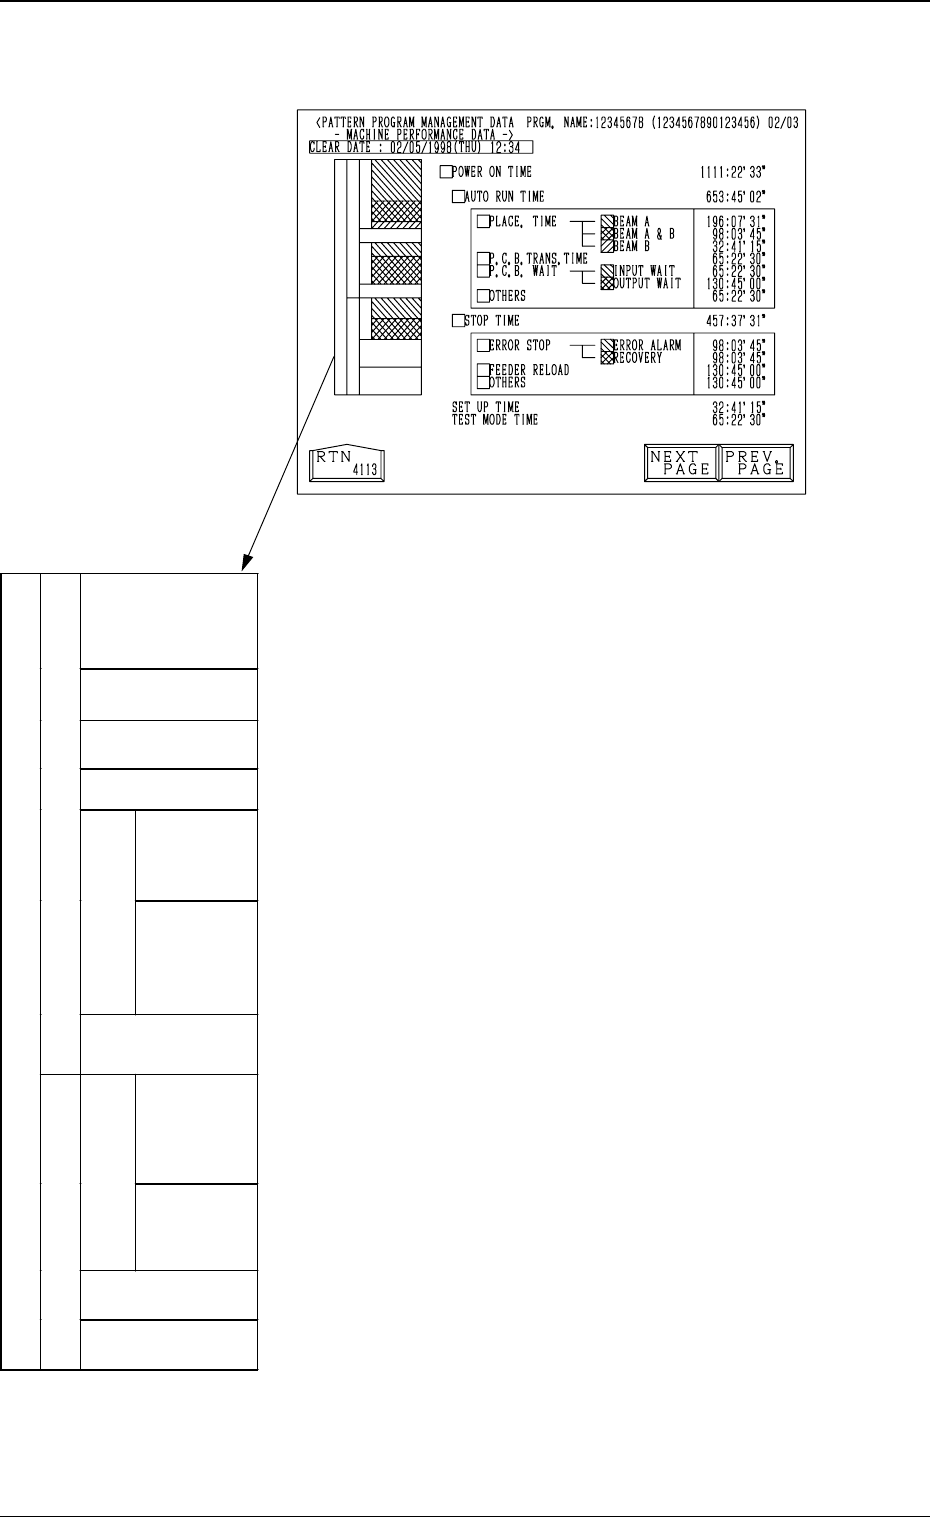
Fig. 4C9
Third Page
3-8
3.1 PATTERN PROGRAM MANAGEMENT DATA Display
0305-001 Tg0860-PM-MM
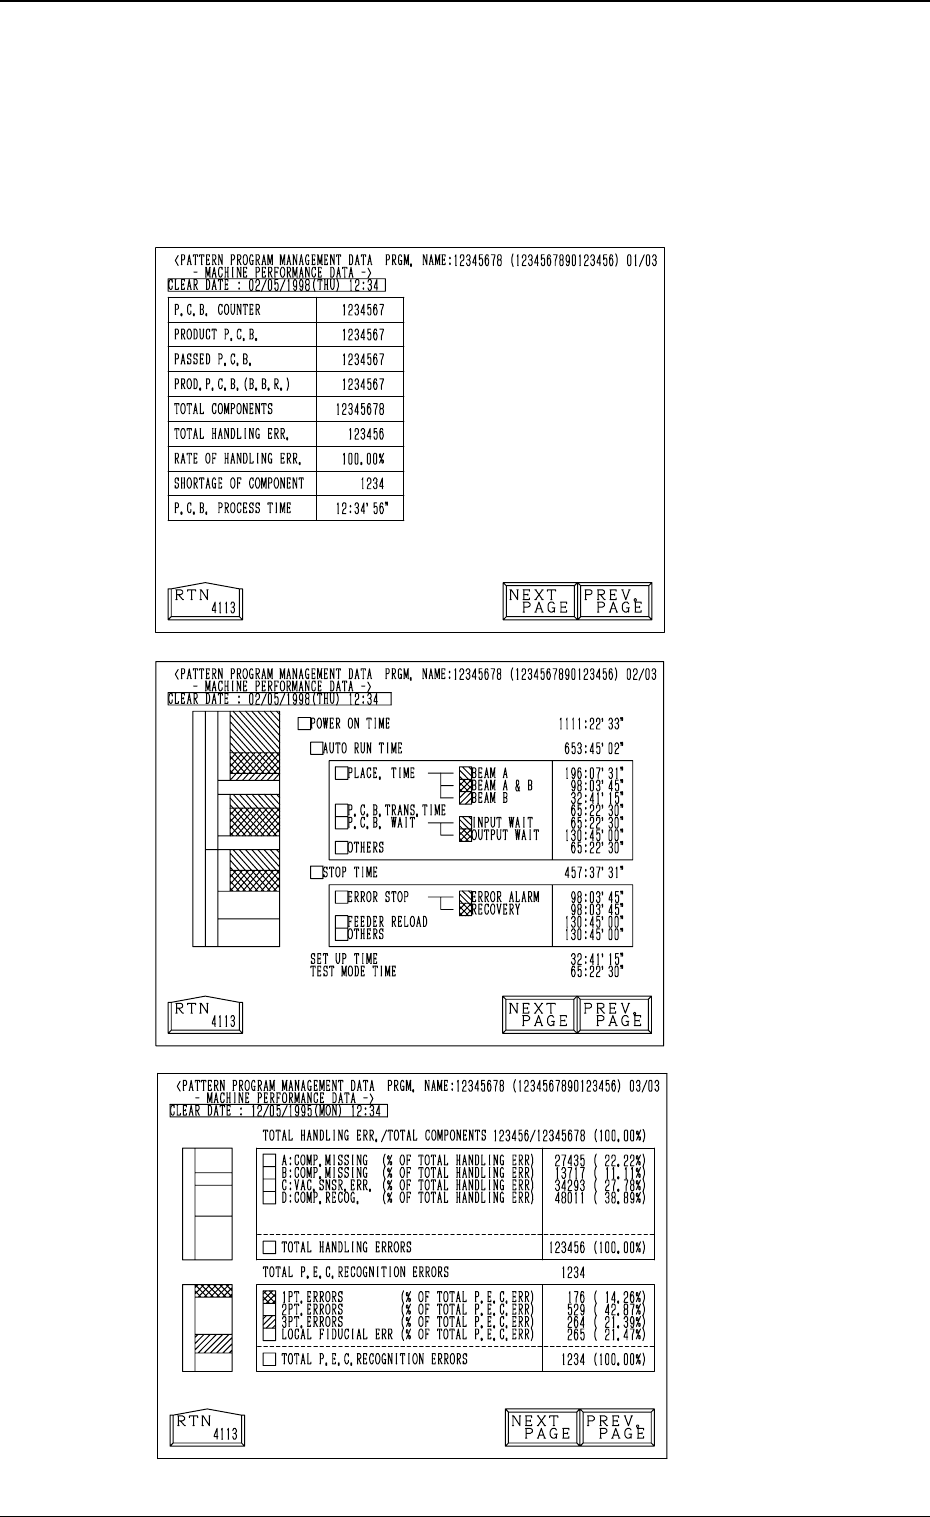
First Page
P.C.B. COUNTER
Shown is the number of produced P.C.B.’s.
Counting is implemented when the X/Y beam is zeroed after component
placement operation (when a P.C.B. is finished).
Note: When a pattern program is set several times as the current program,
the sum total is computed.
PRODUCT P.C.B.
The number of produced unit P.C.B.’s on multi-unit P.C.B. is summed up.
Counting is implemented when the X/Y beam is zeroed after component
placement operation (when a unit P.C.B. is finished).
When the bad board reject (B.B.R.) function (option) is used, defective
unit P.C.B.’s are excluded.
PASSED P.C.B.
The number of passed P.C.B.’s is counted when the machine is set in the
“PASS” mode.
Counting is implemented when the P.C.B. transfer starts (when a positioned
P.C.B. is transferred to the output conveyor).
PROD. P.C.B. (B.B.R.)
Shown is the number of defective P.C.B.’s summed up when the bad board
reject function (option) is used.
TOTAL COMPONENTS
Shown is the number of picked components (the number of pick-up opera-
tions).
TOTAL HANDLING ERR.
Shown is the total number of component handling errors.
RATE OF HANDLING ERR.
Shown is the percentage of handling errors per total number of picked com-
ponents.
SHORTAGE OF COMPONENT
Shown is the number of component shortage errors.
P.C.B. PROCESS TIME
The time between P.C.B. transfer start and the X/Y beam arrival at its
origin (completion of P.C.B. process) is measured during component place-
ment operation and the shortest processing time is displayed.
This does not apply to P.C.B.’s which are processed in step operation or
step-specified operation.
3.1 PATTERN PROGRAM MANAGEMENT DATA Display
3-9
Fig. 4C10
0305-001 Tg0860-PM-MM
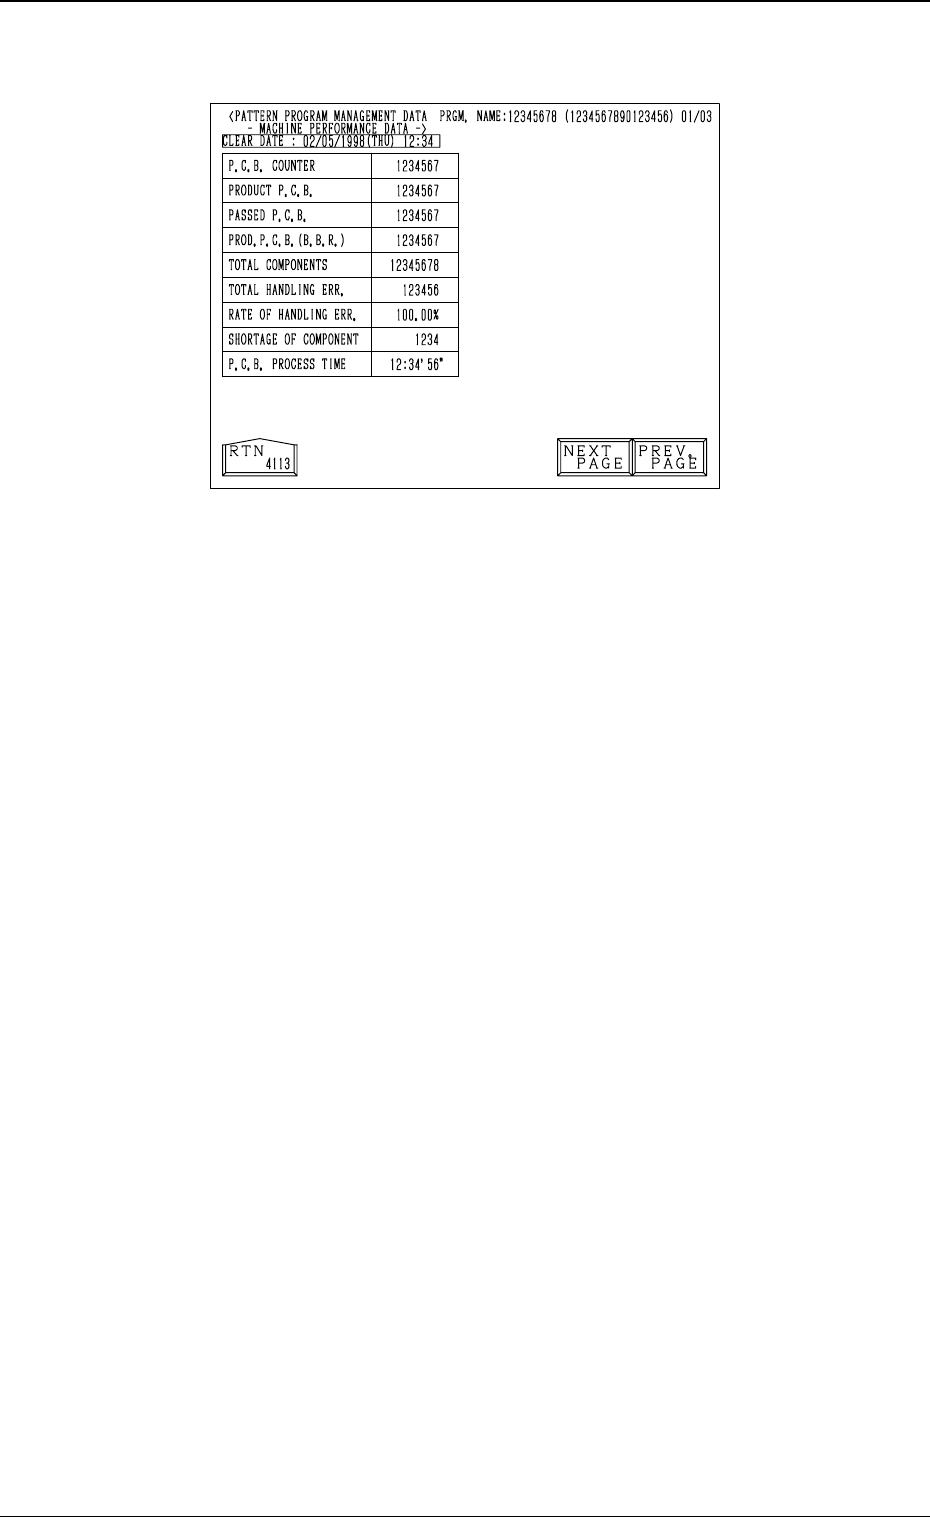
Second Page
POWER ON TIME
Shown is the time when the control power of the machine
is ON.
AUTO RUN TIME
Shown is the time when the machine is running automati-
cally.
When a pattern program is set as the current one several
times, the sum total is computed.
PLACE. TIME
The sum total of placement time is computed.
The placement time of product P.C.B. is summed for
each of Beam A and B.
Placement time of one P.C.B.
The time required from the start of 1st point place-
ment to the last is summed.
Beam A
The sum total of time when only Beam A executes
placement
Beam A & B
The sum total of time when both Beam A and B ex-
ecute placement
Beam B
The sum total of time when only Beam B executes
placement.
Ref.: If a pattern program uses both beams, an im-
portant point of operation is how you can op-
erate Beam A and B together. The higher the
sum total ratio of “Beam A & B” is, the move
efficient the pattern program is.
P.C.B. TRANS. TIME
Indicates the operation time of the transfer motors
[EL conveyor (option), L conveyor, R conveyor, P
conveyor and ER conveyor (option)]
Beam A
(Blue, Meshed)
PLACEMENT
TIME
Beam A/B
(Blue, Meshed)
Beam B
(Blue, Meshed)
P.C.B. TRANS. TIME
(Light Green)
INPUT WAIT
(Blue, Meshed)
(Background:
Yellow)
P.C.B. WAIT TIME
(Yellow)
OUTPUT WAIT
(Blue, Meshed)
(Background:
Yellow)
AUTO RUN TIME (Green)
OTHERS
(Automatic Operation)
(Light Red)
ERROR
ALARM
(Blue, Meshed)
(Background:
Red)
ERROR STOP
(
Red)
RECOVERY
(Blue, Meshed)
(Background:
Red)
FEEDER RELOAD
(Dark Gray)
POWER ON TIME (Sky Blue)
STOP TIME (Magenta)
OTHERS
(Light Red)
3-10
Fig. 4C11
Each time allocated at
power ON is classified
by colors and charted
by columns.
(Data is updated every
5 seconds.)
3.1 PATTERN PROGRAM MANAGEMENT DATA Display
Fig. 4C12