4OM-1011-002.pdf - 第66页
0305-001 Tg0860-PM-MM [RA TE OF ERROR (%)] Key Shown is the percentage of the total number of errors per the number of picked components. [SHTG. OF COMP .] Key Shown is the total number of component shortage errors detec…
0305-001 Tg0860-PM-MM
•
When one of the data keys is pressed, the feeder No. with
the biggest parameter under the selected data key is dis-
played in the first line and feeder Nos. having the subse-
quent (second, third, fourth, ...) biggest parameters follow.
Parameters are displayed in order of error counts, making
it easy to analyze and improve production rate.
When the [FDR. NO.] key is pressed, the parameters are
re-arranged in the default order (ascending order of feeder
Nos.).
•
When one of the carriage selection keys ([TAPE (A)],
[TAPE (B)], [TRAY L] (Option), and [TRAY R] (Option)
keys) is pressed, the parameters related to the selected feeder
carriage are displayed.
[FDR. NO.] Key
Shown under this key are the feeder Nos.
The numbers in ( ) indicate the actual feeder Nos. where
the offset data is added.
[TOTAL COMP.] Key
Shown is the total number of components (the number of
pick-up operations) picked at each feeder.
[A: COMP. MSNG.] Key
Shown is the total number of missing components detected
by the vacuum sensor for each lane (feeder slot No.).
[B: COMP. MSNG.] Key
Shown is the total number of missing components detected
in the recognition processing for each individual feeders.
[C: VAC. SNSR.] Key
Shown is the total number of component pick-up errors de-
tected by the vacuum sensor (errors not detected through
the component recognition) for each individual feeders.
[D: COMP. RECOG.] Key
Shown is the total number of recognition errors detected in
the recognition processing for each individual feeders.
[TOTAL ERRORS] Key
Shown is the total number of errors detected by the above-
described functions ([A: COMP. MSNG.] through [D:
COMP. RECOG.] Keys).
Fig. 4C17
*A
3.1 PATTERN PROGRAM MANAGEMENT DATA Display
3-14
0305-001 Tg0860-PM-MM
[RATE OF ERROR (%)] Key
Shown is the percentage of the total number of errors per the number of
picked components.
[SHTG. OF COMP.] Key
Shown is the total number of component shortage errors detected for each
individual feeders.
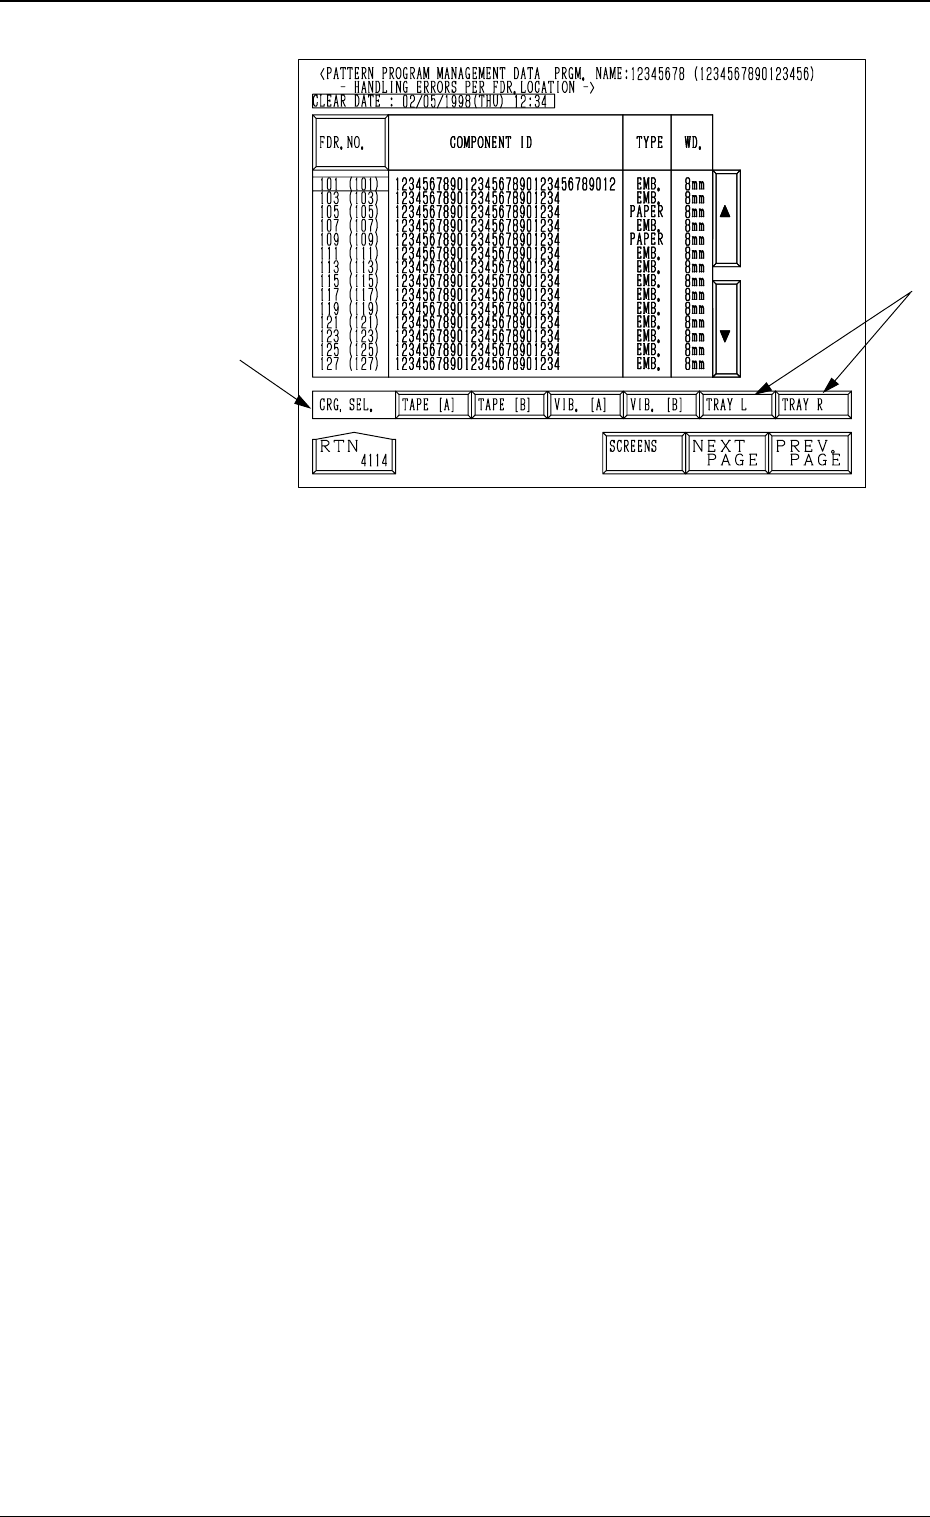
COMPONENT ID
Shown are the component IDs for each individual feeders.
TYPE
Shown are the types of tapes for the related component IDs.
(Paper, Embossed, Adhesive, Bulk, Bulk 2 Tapes or Stick, Vibratory Stick,
Tray Feeders, etc.)
WD.
Shown are the widths of tapes for the related component IDs.
(8 mm, 12 mm, 16 mm, 24 mm, 32 mm, 44 mm, 56 mm, or 72 mm)
Note: When a stick, a vibratory stick, or a tray feeder is used, “- - - - -”
appears in the data field.
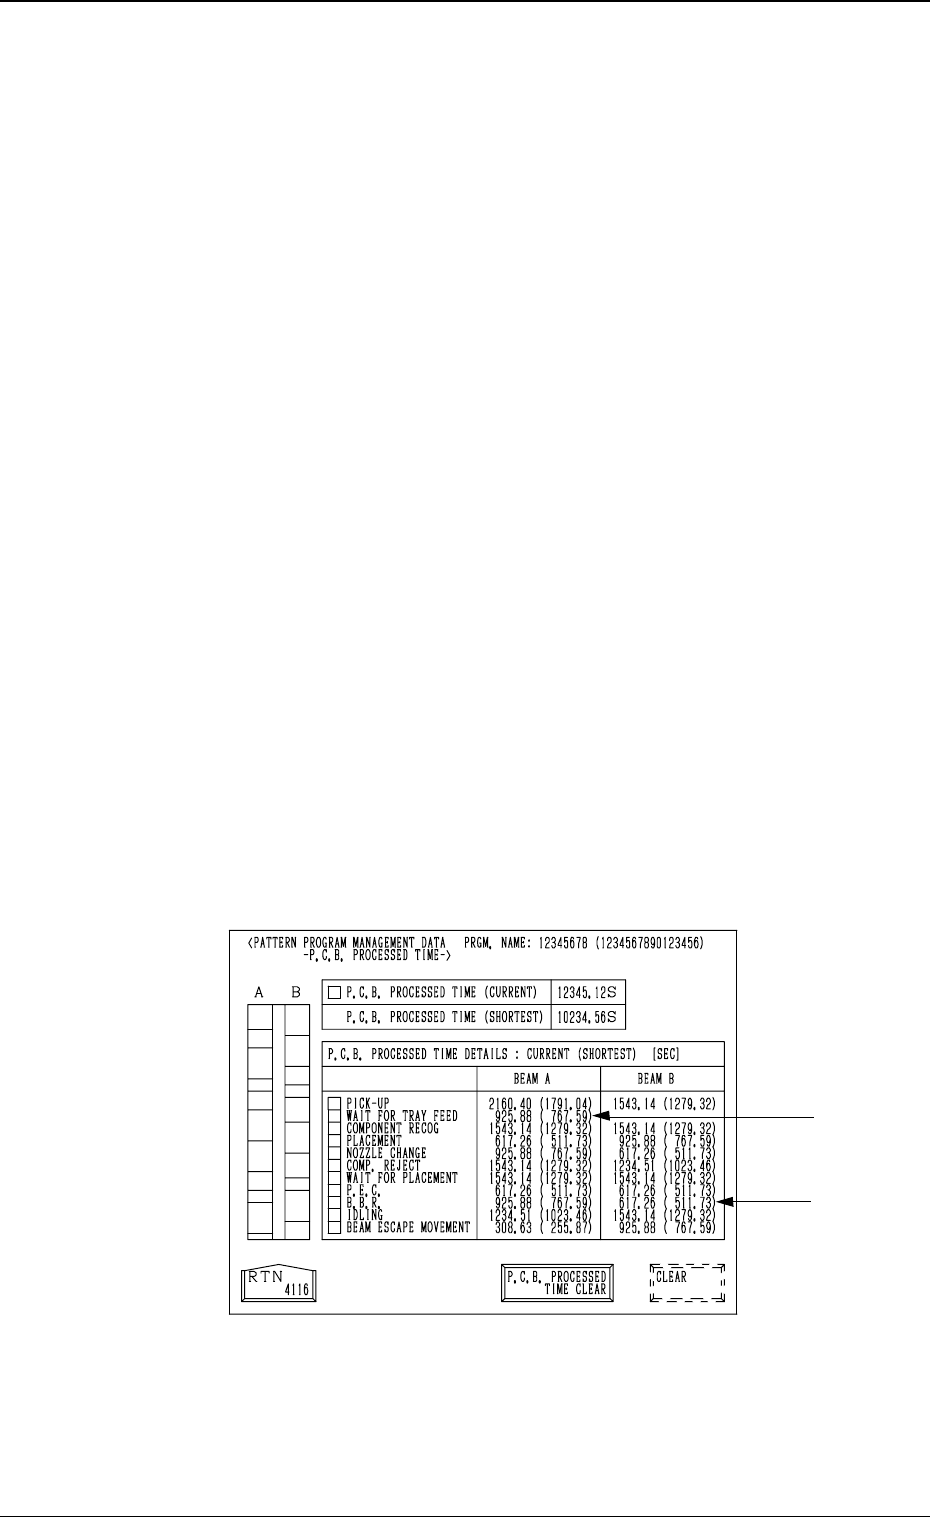
(4) P.C.B. Processed Time
When the [P.C.B. PROCESSED TIME] key is pressed at the “PAT-
TERN PROGRAM MANAGEMENT DATA” display, the following dis-
play appears on the screen.
The display in Fig. 4C18 is an example when the multi-tray feeder (option)
is used and the Unit P.C.B. B.B.R. function (option) is included.
Notes: (a) Shown are the periods of time during which the X/Y beam
is completely zeroed after the machine starts to transfer a
P.C.B. to the P.C.B. positioning section and completes the
last component placement operation.
(b) When the multi-layer tray feeder (option) is used, the P.C.B.
processing time may differ greatly (compared with other
feeders), depending upon the following conditional differ-
ence.
•
Travel of X/Y Beam (Direct Pick-Up from Tray)
•
Waiting Time, etc., due to the pullout/pushback actions
of the pallet
(c) The -marked items are optional.
P.C.B. PROCESSED TIME (CURRENT)
Shown is the newest P.C.B. process time.
P.C.B. PROCESSED TIME (SHORTEST)
Shown is the shortest P.C.B. process time required so far.
[P.C.B. PROCESSED TIME CLEAR] and [CLEAR] Keys
To clear the data in the “P.C.B. PROCESSED TIME (CURRENT)” and
“P.C.B. PROCESSED TIME (SHORTEST)” text boxes, press the [P.C.B.
PROCESSED TIME CLEAR] key and then the [CLEAR] key.
Fig. 4C18
3.1 PATTERN PROGRAM MANAGEMENT DATA Display
3-15
0305-001 Tg0860-PM-MM
PICK-UP
Shown are the total periods of time during which the pick-up position is
moved and the up and down movement is taken for component picks.
(Each time includes the period of time during which the heads wait for
each feeder to be replenished with components.)
WAIT FOR TRAY FEED (Option)
Shown are the total periods of time during which the machine waits for
the tray to be fed after Beam A has moved to the tray pick-up position
(matrix position).
COMPONENT RECOG
Shown are the total periods of time during which the machine moves the
component recognition position and the component recognition is pro-
cessed.
PLACEMENT
Shown are the total periods of time during which the machine moves the
component placement position and takes the up/down movement for
component placement.
NOZZLE CHANGE
Shown are the total periods of time during which the machine takes the
nozzle change movement and the nozzle change operation.
COMP. REJECT
Shown are the total periods of time during which the machine moves to
the position where rejected (recognition error) components are discharged
and takes the up/down movement to discharge such components.
WAIT FOR PLACEMENT
Shown are the total periods of time during which the machine waits for
the movement to the placement area to become possible through the
beam cooperative movement after the component recognition is com-
pleted.
P.E.C.
Shown are the total periods of time during which the machine moves the
P.E.C. recognition position and executes the P.E.C. recognition.
B.B.R. (Option)
Shown are the total periods of time during which the bad mark detection
position is moved and the machine executes the bad mark detection.
IDLING
Shown are the periods of time during which the beams are kept idle due
to the difference in allocation between Beams A and B.
BEAM ESCAPE MOVEMENT
When Beam A or B is activated and the deactivated beam is located in
the interference area, the deactivated one moves back to its escape posi-
tion and the other one is activated.
The turnout time is the total time required for the escaped beam to set
ready for activation after the other beam has started escaping and the
activated one has completed its movement.
When it takes a lot of time for the beam to move back to its escape
position, it means that the movement of both beams are not coordinated
well, making the movement inefficient.
Note: When the machine is stopped temporarily during component place-
ment operation or the machine starts its operation in the middle of
steps according to the designated mode of the semi-automatic op-
eration (placement step), these periods of time are not measured.
When the machine is set in the component supply mode due to a
material shortage, these periods of time are not measured, either.
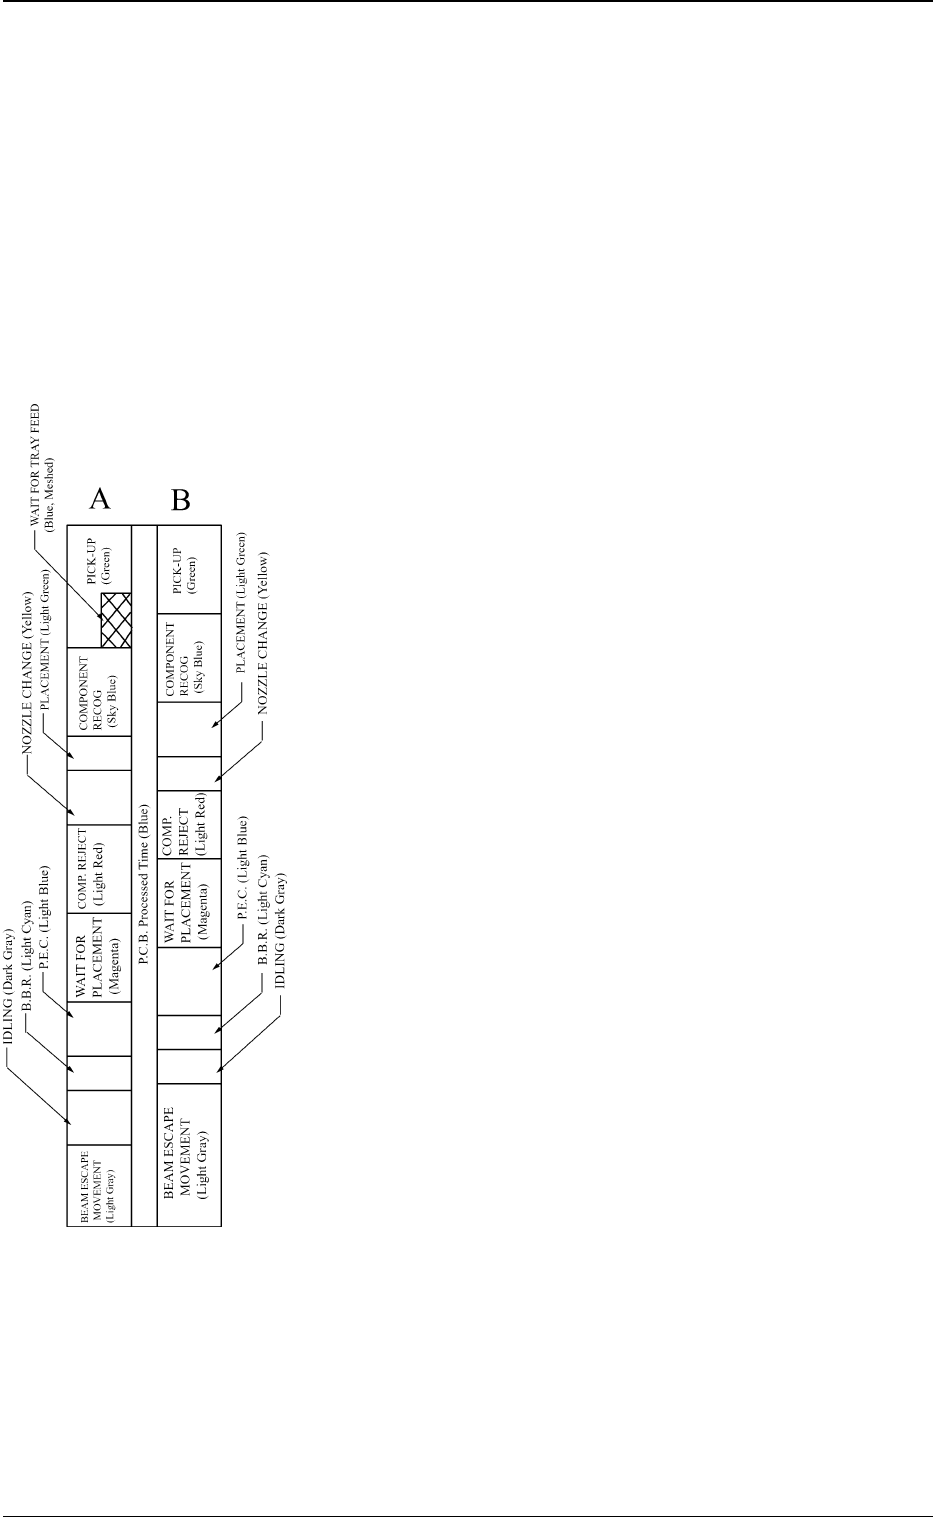
Each parameter (allocation of each
operation time) allocated to the
current P.C.B. process time is clas-
sified by colors and charted by
columns.
The less waiting time is required
for both Beams A and B, the more
efficiently the machine is running.
3.1 PATTERN PROGRAM MANAGEMENT DATA Display
3-16
Fig. 4C19