4OM-1011-002.pdf - 第72页
0305-001 Tg0860-PM-MM • When one of the data keys is pressed, the feeder No. with the biggest param- eter under the selected data key is displayed in the first line and feeder Nos. having the subsequent (second, third, f…
0305-001 Tg0860-PM-MM
(CURRENT DATA)
[SCREENS] Key
Fig. 4C24
[SAVED/CURRENT] Key
Saved Data
Fig. 4C25
3-20
3.2 Component Handling Error Rate Data

0305-001 Tg0860-PM-MM
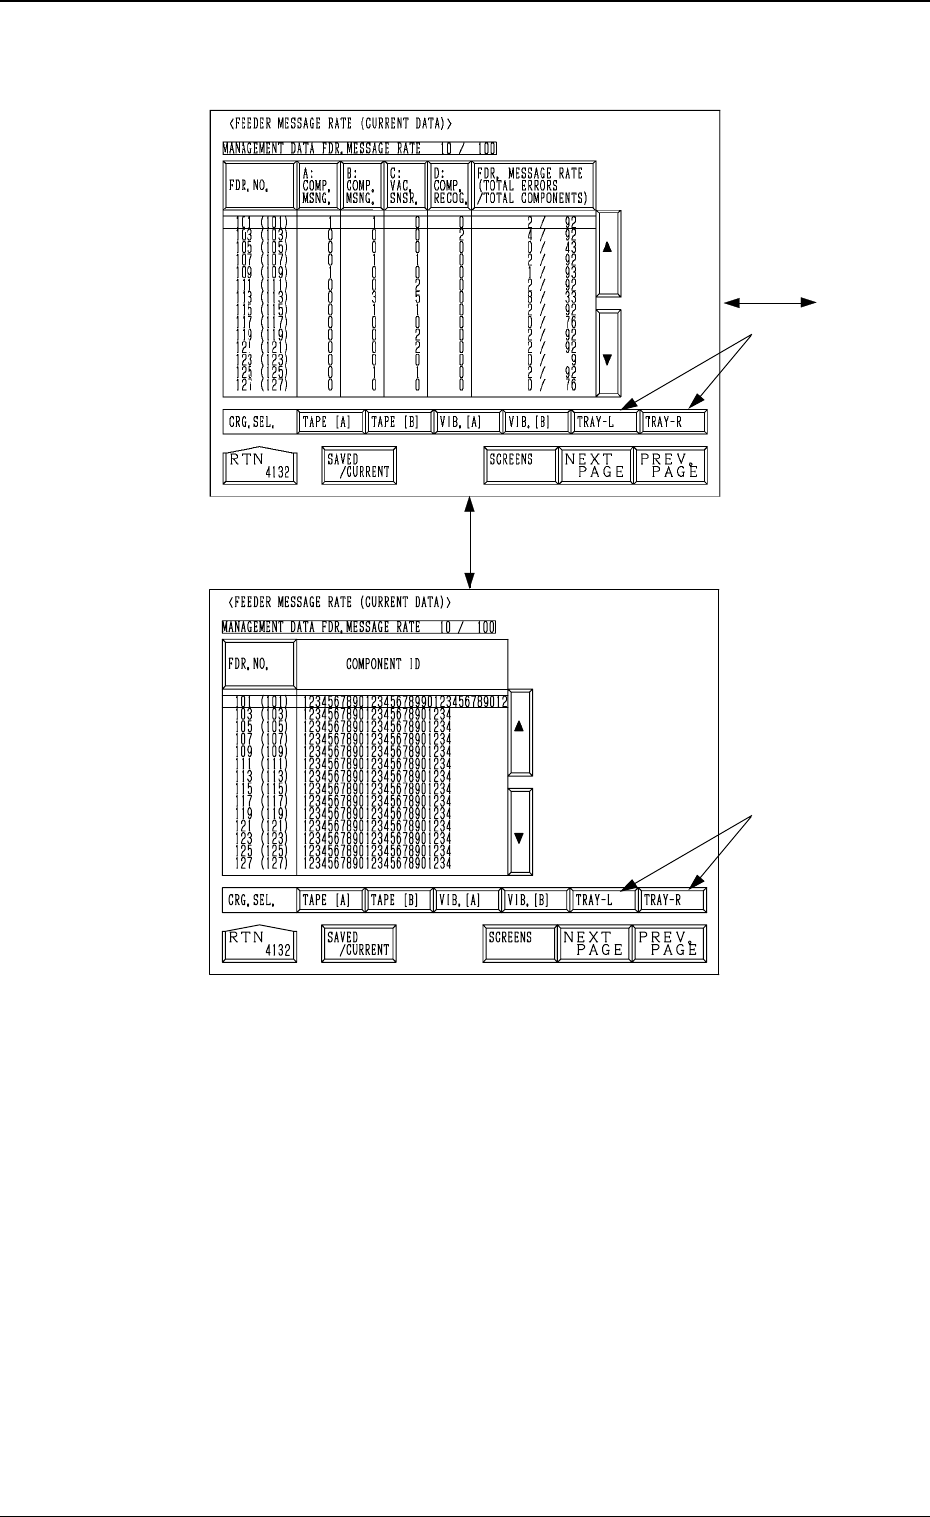
• When one of the data keys is pressed, the feeder No. with the biggest param-
eter under the selected data key is displayed in the first line and feeder Nos.
having the subsequent (second, third, fourth, ...) biggest parameters follow.
When the [FDR. NO.] key is pressed, feeder Nos. are arranged in their ini-
tial order.
• When the [CRG. SEL.] key is pressed, the display for the corresponding
feeder carriage appears on the screen.
• Parameters set at the “AUTO OPERATION SET-UP (02/03)” display are
displayed after the label “MANAGEMENT DATA FDR. MESSAGE RATE”.
“Saved Data” : Shown are the parameters calculated just before the cur-
rent parameters.
“Current Data” : Shown are the parameters being calculated at present.
Examples in Figs. 4C22, 4C23, 4C24 and 4C25 :
MANAGEMENT DATA FDR. MESSAGE RATE 10/100: Numerator 10 shows
the number of pick-up errors detected before 100 components are picked up.
Denominator 100 shows that 100 components are to be picked up. When 10
pick-up errors are detected, a message appears in the “MGT. INFO.” text box,
indicating that the pick-up rate has deteriorated. When the number of pick-up
errors does not reach “10” after 100 components are picked up, XX/XX is
reset to “00/00” and counting starts again.
The “FEEDER MESSAGE RATE (SAVED DATA)” shows the parameters
just before this delimiter.
• When an alarm is issued, the blue feeder No. turns red at the “FEEDER
MESSAGE RATE (SAVED DATA)” display.
3-21
3.2 Component Handling Error Rate Data
0305-001 Tg0860-PM-MM
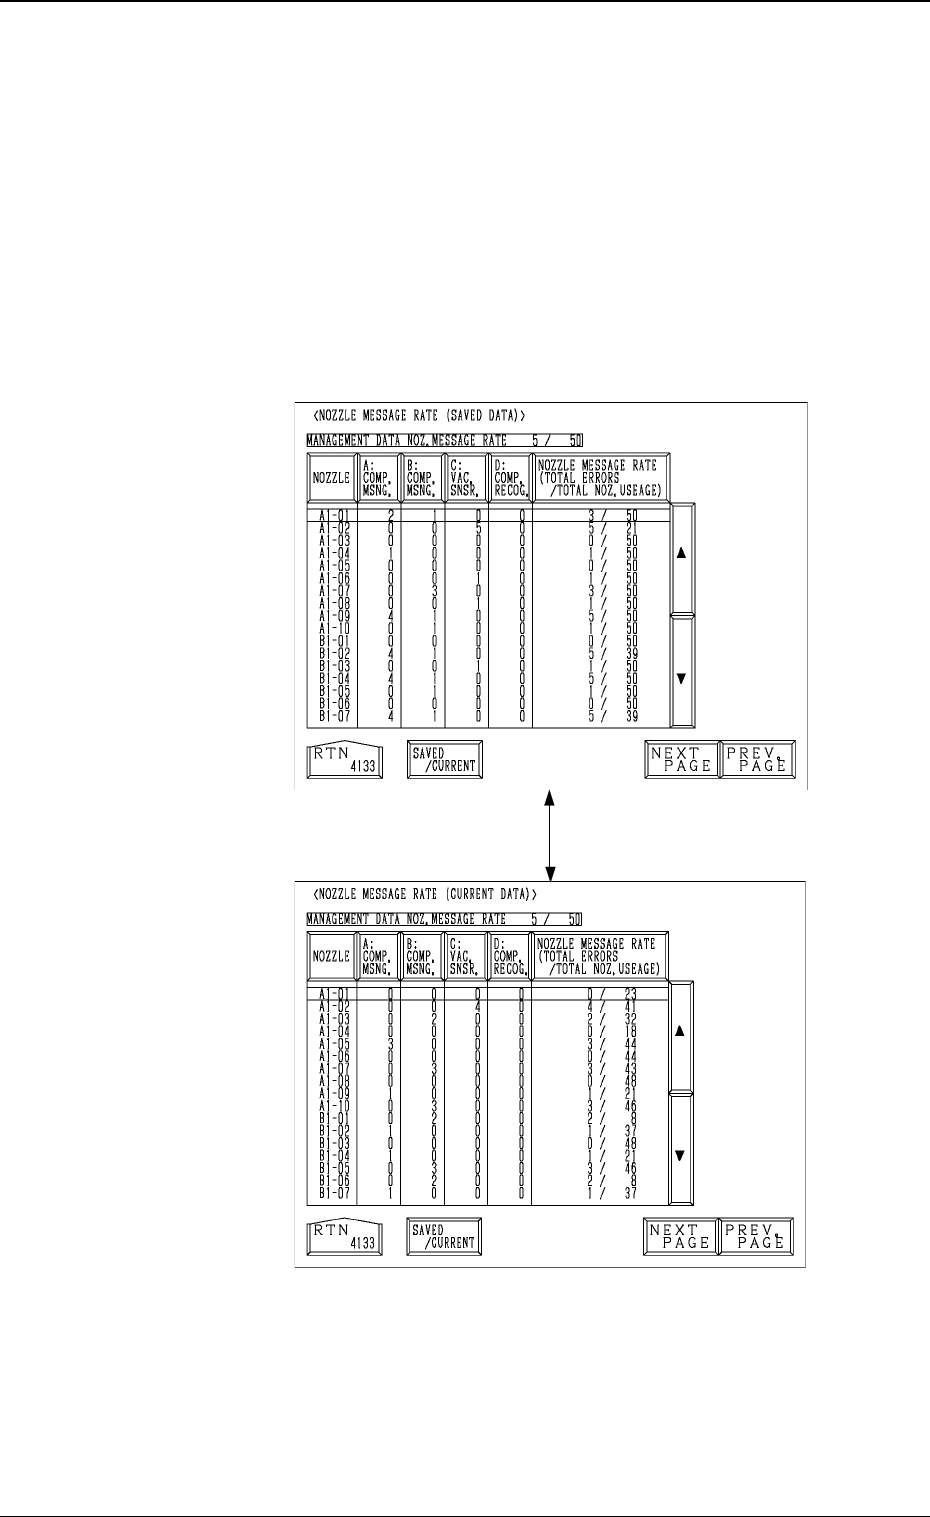
3.2.2 Nozzle Message Rate
Pick-up rates managed for each nozzle are displayed accord-
ing to the parameters specified at the “AUTO OPERATION
SET-UP” display.
When the [NOZZLE MESSAGE RATE] key is pressed at the
“COMP. HANDLING ERROR RATE DATA” display, the fol-
lowing display appears on the screen.
When the [SAVED/CURRENT] key is pressed, the “NOZZLE
MESSAGE RATE (SAVED DATA)” display disappears and
the “NOZZLE MESSAGE RATE (CURRENT DATA)” ap-
pears or vice versa.
• When one of the data keys is pressed, the nozzle No. with
the biggest parameter under the selected data key is dis-
played in the first line and nozzle Nos. having the subse-
quent (second, third, fourth, ...) biggest parameters follow.
When the [NOZZLE] key is pressed, nozzle Nos. are ar-
ranged in their initial order.
Fig. 4C27
Fig. 4C26
[SAVED/CURRENT] Key
3-22
3.2 Component Handling Error Rate Data
Display Sequence
“MAIN MENU”
↓
“DATA EDIT”
↓
“AUTO OPERATION SET-
UP”
↓
“COMP. HANDLING ER-
ROR RATE DATA”
↓
“NOZZLE MESSAGE RATE
(SAVE DATA)”
SAVED DATA
CURRENT DATA