00196577-03 JG S-Feeder Care Test Station EN.pdf - 第33页
Performing the Test – Results Display: Details 33 There are two tolerance areas: 1. The two orange lines mark the limits of the tolerance area. These lines have a fixed positi on. The lines corresp ond to the orange rect…
Performing the Test – Results Display: Details
32
– Results Display: Details
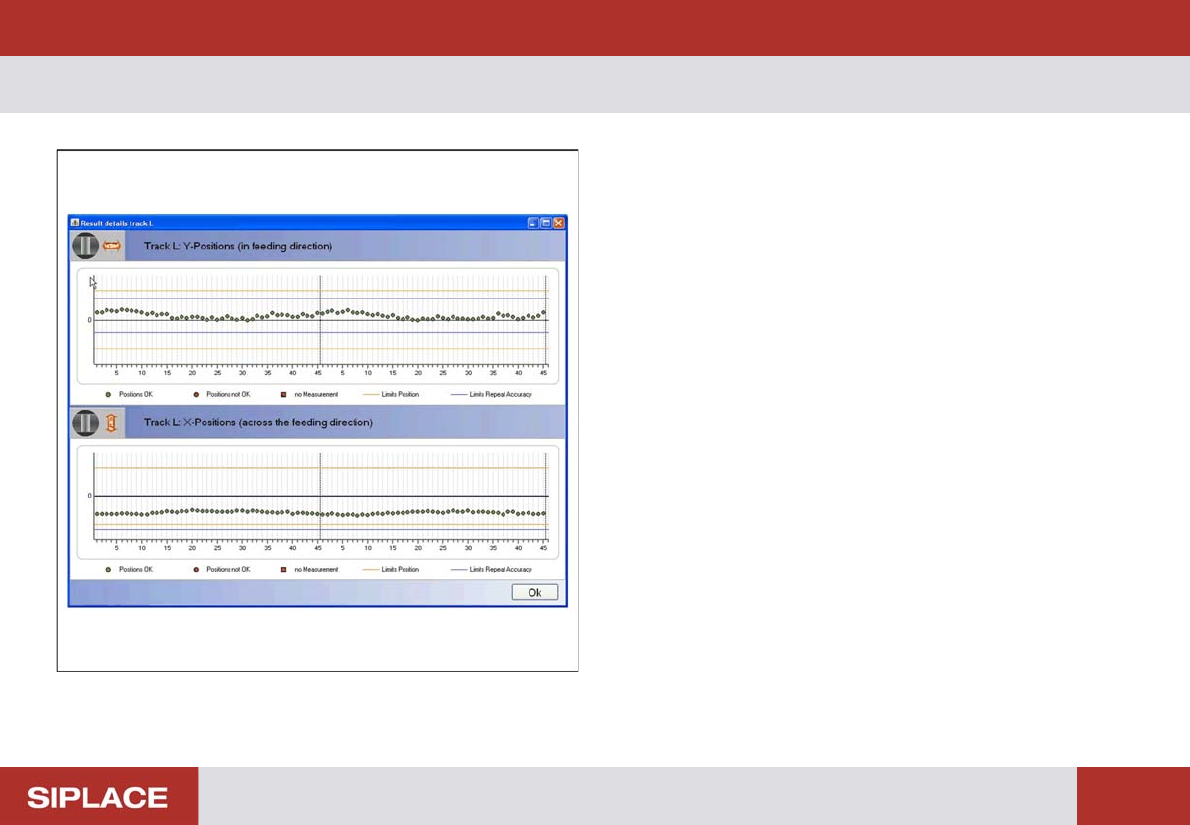
The Result Display Details Track L / M / R shows the meas-
uring result for each individual track in the X and Y directions
as a graphic. The upper part of the displayed graphic shows
the position of the individual teeth in the direction of feeding
while the lower part shows the individual teeth across the di-
rection of feeding.

Performing the Test – Results Display: Details
33
There are two tolerance areas:
1. The two orange lines mark the limits of the tolerance area.
These lines have a fixed position. The lines correspond to
the orange rectangle in the camera image.
2. The two blue lines mark the limits of the worm gear play.
These lines can be shifted according to the average value
of the measurements.
The green dots show the measuring results which are inside
the two tolerance areas.
The red dots show measuring values which are outside at
least one of the tolerance areas.
Red squares show positions at which measurement failed.
Click on OK to close the dialog box and view the results dis-
play again.
Performing the Test – Results Display: Name Protocol
34
– Results Display: Name Protocol
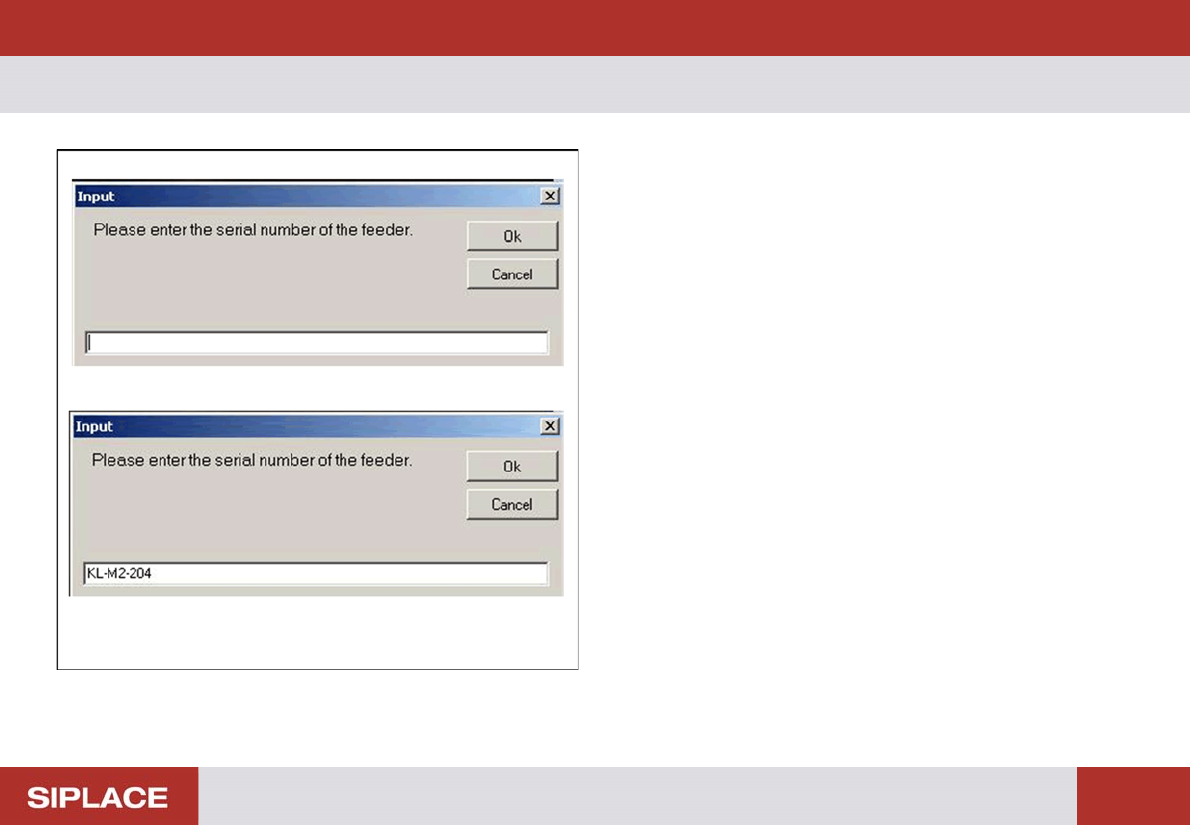
If you click on the Protocol… button in the results display,
the adjacent dialog box will be shown. To make sure that
you are able to clearly identify or assign the log file later on,
enter the serial number of the tested feeder in the dialog
box.
If installed, a BC scanner can be used as input device.
Place the cursor in the input window for that.
Scan the feeder barcode.
The name entered will be shown in the header of the log file.
Click on OK to close the dialog box and view the log file.