0197787-01_UM_HeadVerification_708_EN.pdf - 第20页
SIPLACE Head V erification User Manual Edition 01/2015 20 4.1.2 Explanation of Measurement Results in "Progress" Menu After com pletion of the measurem ent, the following res ults appear in the " Progress&…

SIPLACE Head Verification
User Manual Edition 01/2015
19
4 Description of Measurements
The following chapters describe the individual measurements.
The screenshots used are only examples. Depending on the head type being measured, these may
vary slightly.
The nozzle quantities mentioned refer only to the head to be measured. In vacuum pump mode, you
may need additional nozzle configurations on the head opposite the placement area. (see chapter 5.2)
4.1 "Component Sensor Voltage and Z Heights" Measurement
The following tools are required for these measurements:
CPP: 12x nozzle type 2069 03094135-01 (vacuum nozzle red, closed)
CP20P: 20x nozzle type 4069 03106244-01 (vacuum nozzle red, closed)
CP20A: 20x nozzle type 1069 03094112-01 (vacuum nozzle red, closed)
4.1.1 Explanation of Measurement – Procedure
The measurement "Component sensor voltage and z-heights" is used to determine the function of the
component sensor and the Z axis values during upwards and downwards movement by the
component sensor.
The results of these measurements provide feedback about the following sources of errors:
1. Component sensor function
2. Component sensor contamination
3. Bad nozzle seat
4. State of linear guide DP
5. State of driver bearing DP
6. State of Z motor bearing and driver
Measurement steps:
The closed vacuum nozzles are set up on the segments.
1. Firstly, the component sensor function is checked by determining the analog voltage value in
its uncovered state. This value must be within the range defined for correct component sensor
function.
The value determined is known as Component sensor voltage and must be between the
Min and Max values. If the analog value determined is below this, it is assumed that the
component sensor is either dirty or that the lens prism is defective or that the internal
electronics no longer function correctly!
2. The machine then performs a height reference run on the conveyor side. After this, the head
moves over the nozzle station, where the Z axis applies travel profile TP13 [TP13 NOZZLE
CHANGER DOWN] to press the nozzles with high force onto the segment, ensuring the best
possible nozzle seat.
3. The machines then moves over the conveyor side again.
4. The Z axis moves down to the conveyor side and determines for each segment how the
component sensor is enabled during downwards and upwards movement of the Z axis.
During downwards movement of the Z axis, the travel profile TP5 [TP5 LIGHT BARRIER] is
used to determine the end signal with the light barrier. During upwards movement, the nozzle
interrupts the component sensor beam. This generates the value Z-down [µm]
The upwards movement of the Z axis is performed with the travel profile TP1 [TP1 ABSOLUT
DEFAULT]. As soon as the nozzle releases the component sensor, the Z-up [µm] value is
issued.
5. The difference between the Z-down and Z-up is the hysteresis of the Z axis.This results from
the tolerances in the bearings of the axes affected and the nozzle holder spring in the DP
drive. During a downwards movement (negative acceleration), the spring is compressed
slightly and is then slightly extended again during the upwards movement (positive
acceleration), due to the inertia!
SIPLACE Head Verification
User Manual Edition 01/2015
20
4.1.2 Explanation of Measurement Results in "Progress" Menu
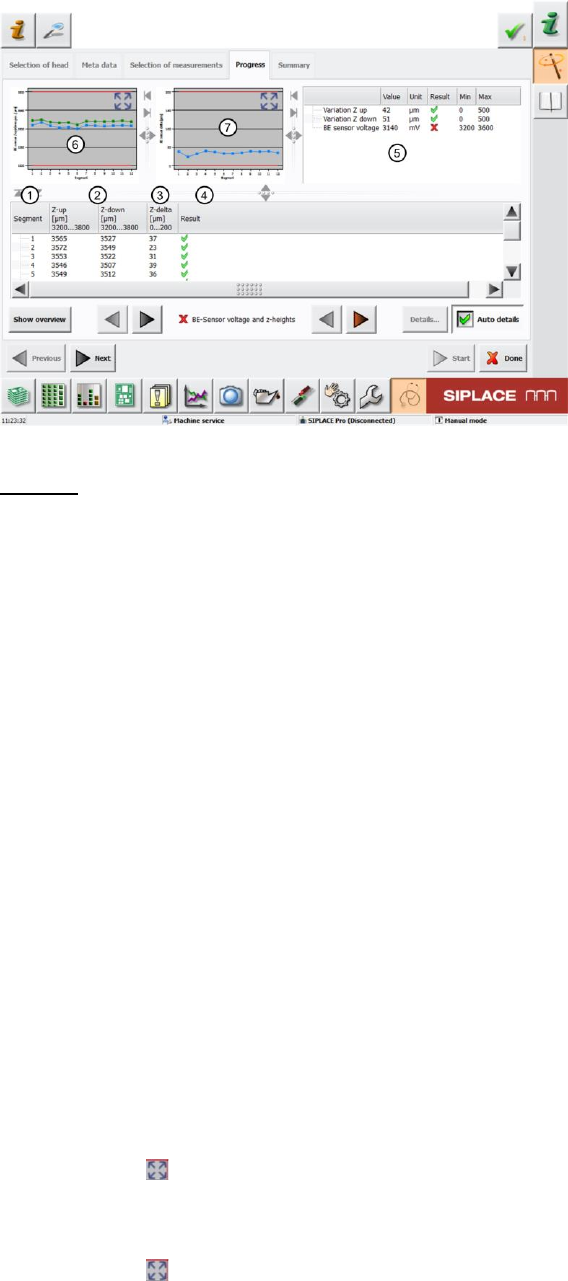
After completion of the measurement, the following results appear in the "Progress" menu:
Figure 12: Component sensor voltage and z-heights result - Progress menu
Legend:
1. Segment measured
2. Value calculated for Z-down [µm] this value occurs when the nozzle interrupts the
component sensor laser beam during downwards movement. This value must be within a
plausible tolerance (in this case 3200..3800µm).
Value calculated for Z-up [µm] this value occurs when the nozzle releases the component
sensor again during upwards movement. This value must be within a plausible tolerance (in
this case 3200..3800µm).
3. The value for Z-delta [µm] is calculated using the difference between "Z-up" and "Z-down".
The "Z-delta" value describes the hysteresis of the complete system for this DP (segment).
This hysteresis value must be within a plausible tolerance (in this case 0..200µm).
0µm < Z-delta [µm] = Z-up [µm] – Z-down [µm] < 200µm
4. Results display (OK green tick / NOK red X)
5. The following values are displayed here:
a. Variation Z-up This value is determined from the difference between the lowest "Z-
up" (2) value and the highest "Z-up" (2) value. This value must be within a plausible
tolerance (in this case 0..500µm).
b. Variation Z-down This value is determined from the difference between the lowest
"Z-down" (2) value and the highest "Z-down" (2) value. This value must be within a
plausible tolerance (in this case 0..500µm).
c. BE sensor voltage This is the analog voltage value at the uncovered component
sensor.This value must be within a plausible tolerance, as defined for correct
functioning. In our example, the lower minimum tolerance value of 3200 has been
incorrectly programmed in the software (corrected from figure 126)
6. This diagram illustrates the segment values "Z-up" and "Z-down". Green line Z-up
Blue line Z-down
Red border Min and max tolerances (in our case 3200..3800µm)
Use the button to zoom in on the diagram.
7. This diagram illustrates the "Z-delta" hysteresis values for the segments.
Blue line Z-delta
Red border Min and max tolerances (in our case 0..200µm)
Use the button to zoom in on the diagram.
SIPLACE Head Verification
User Manual Edition 01/2015
21
4.1.3 Explanation of Measurement Results Using Results PDF
These results can be seen if you scroll down the "Summary" menu or generate a results PDF!
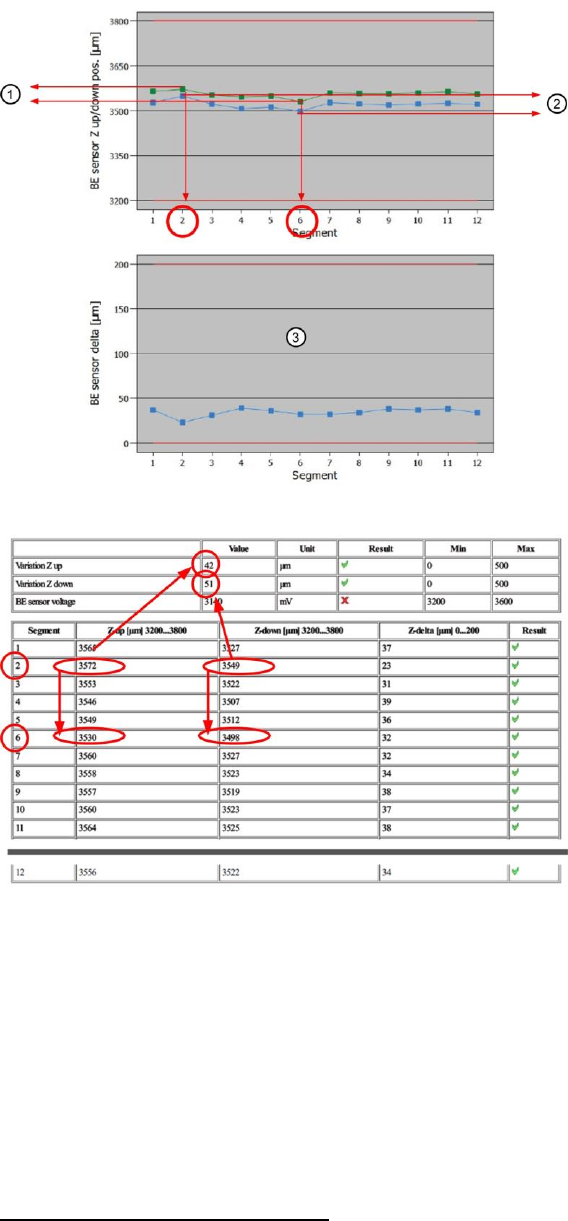
Figure 13: Results PDF for component sensor diagram
Figure 14: Component sensor table results
The "Variation Z-up" (1) value is calculated from the lowest "Z-up" value for segment 6 and the highest
"Z-up" value for segment 2! -> 3572µm – 3530µm = 42µm (1)
The "Variation Z-down" (2) value is calculated from the lowest "Z-down" value for segment 6 and the
highest "Z-down" value for segment 2! -> 3549µm – 3498µm = 51µm (2)
The hysteresis values for each segment "Z-delta" are calculated from the difference between "Z-up"
and "Z-down"! -> Segment 4 as example: 3546µm – 3507µm = 39µm (hysteresis)
4.1.4 Meaning of the Results
"Component sensor voltage" error
If the measured analog voltage value is under the plausible tolerance, the following causes and
measures apply: