0197787-01_UM_HeadVerification_708_EN.pdf - 第49页
SIPLACE Head V erification User Manual Edition 01/2015 49 4.8.2 Explanation of Measurement Results in "Progress" Menu After com pletion of the measurem ent, the following res ults appear in the " Progress&…

SIPLACE Head Verification
User Manual Edition 01/2015
48
4.8 "Head Endurance Run LS" Measurement
The following tools are required for these measurements:
CPP: 12x nozzle type 2057 03070280-01 (calibration nozzle)
CP20P: 20x nozzle type 4235 03098748-01 (calibration nozzle)
CP20A: 20x nozzle type 1235 03015222-01 (calibration nozzle)
4.8.1 Explanation of Measurement – Procedure
The "Head endurance run LB" measurement is used to determine the actual position deviations of the
Z axis and the minimum and maximum path of the segments during pickup and placement. The DP
drive positioning times for a rotation from 0° to 180° are documented and can be used to evaluate the
DP quality.
The results of these measurements provide feedback about the following sources of errors:
1. Difficult movement of DP drives
2. State of Z motor linear guides
3. State of DP/segment linear guides
4. Assembly and state of cover switching ring
5. State of Z-down light barrier
Measurement steps:
1. The head is positioned over the height reference run position on the fixed conveyor side.
2. Segment 1 is rotated by the star into the placement position.
3. The Z axis is moved downwards using travel profile TP5 [TP5 LIGHT BARRIER] and the
pickup procedure is simulated. As soon as the Z-down light barrier issues the end position
signal, the end signal position value will be saved as Z Pick [µm].
4. During the downwards movement, the DP is also positioned at 0°. This gives a positioning
time of DP time [ms].
5. The Z axis now moves back up again with travel profile TP1.
6. The Z axis is moved downwards for placement using travel profile TP5 [TP5 LIGHT
BARRIER]. As soon as the Z-down light barrier issues the end position signal, the end signal
position value will be saved as Z Place [µm].
7. During the downwards movement, the DP is also positioned at 180°. This gives a positioning
time of DP time [ms].
8. The Z axis now moves back up again with travel profile TP1.
9. This procedure is now executed 50x for segment 1, which means a total of 100x Z axis
movements (50x pickup / 50x place) and also 100x DP positioning times.
10. All pickup positions Z-Pick [µm] are saved internally and the minimum (Z min pick [µm]) and
maximum (Z max pick [µm]) positions are used for the analysis.
11. All placement positions Z-Place [µm] are saved internally and the minimum (Z min place
[µm]) and maximum (Z max place [µm]) positions are used for the analysis.
12. The positioning times for rotation of each segment by 180° are also analyzed, to provide a
minimum (Min DP Time [ms]) and maximum (Max DP Time [ms]) value for each segment.
13. The star now turns segment 2 into the placement position
14. Measurements 3-13 are now performed for all other segments.
SIPLACE Head Verification
User Manual Edition 01/2015
49
4.8.2 Explanation of Measurement Results in "Progress" Menu
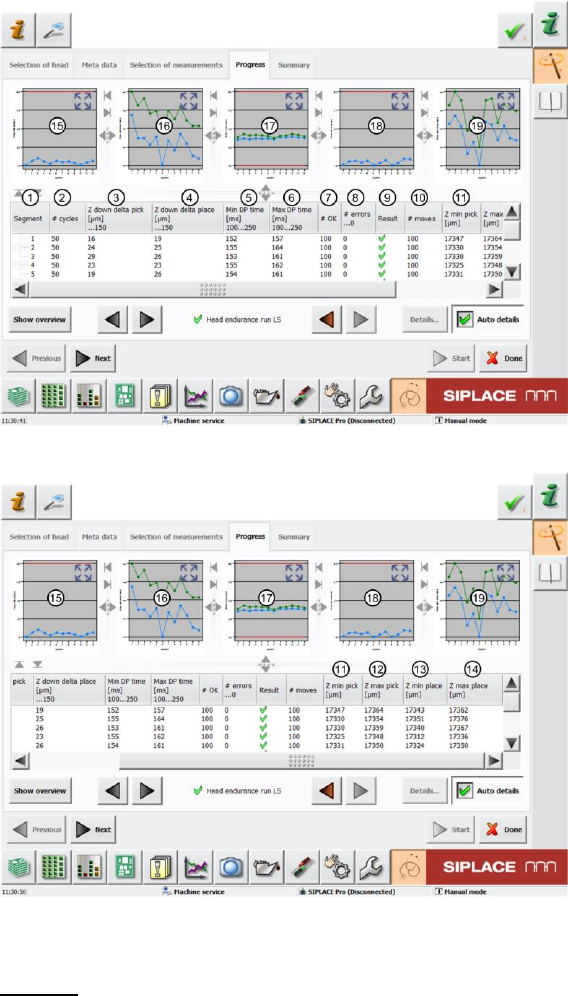
After completion of the measurement, the following results appear in the "Progress" menu:
Figure 32: Head endurance run LS _1 result
Figure 33: Head endurance run LS _2 result
Legend:
1. Segment measured
2. Total number of cycles
3. Value determined Z down delta pick [µm]
This value is calculated by finding the difference between the lowest (Z min pick [µm] (11))
and the highest (Z max pick [µm] (12)) Z axis positioning value after switching the Z-down
light barrier during the pickup cycles.
This value must be within a plausible tolerance (in this case 0..150µm)!
Z down delta pick [µm] = Z max pick [µm] - Z min pick [µm]
4. Value determined Z down delta place [µm]
This value is calculated by finding the difference between the lowest (Z min place [µm]
(13)) and the highest (Z max place [µm] (14)) Z axis positioning value after switching the Z-
down light barrier during the pickup cycles.

SIPLACE Head Verification
User Manual Edition 01/2015
50
This value must be within a plausible tolerance (in this case 0..150µm)!
Z down delta place [µm] = Z max place [µm] - Z min place [µm]
5. The Min DP time [ms] value is the shortest DP positioning time reached during positioning at
180°. This value must be within a plausible tolerance (in this case 100..250µm)!
6. The Max DP time [ms] value is the longest DP positioning time reached during positioning at
180°. This value must be within a plausible tolerance (in this case 100..250µm)!
7. Results display for number of successful strokes
8. Number of errors during 50x total cycles.
9. Results display (OK green tick / NOK red X)
10. Number of individual Z axis movements (in our case 50x down + 50x up = 100)
11. Z min pick [µm] is the lowest Z axis positioning value achieved after switching the Z-down
light barrier during the pickup cycles.This value is used to calculate the Z down delta pick
[µm] (3) value.
12. Z max pick [µm] is the highest Z axis positioning value achieved after switching the Z-down
light barrier during the pickup cycles.This value is used to calculate the Z down delta pick
[µm] (3) value.
13. Z min place [µm] is the lowest Z axis positioning value achieved after switching the Z-down
light barrier during the placement cycles.This value is used to calculate the Z down delta
place [µm] (4) value.
14. Z max place [µm] is the highest Z axis positioning value achieved after switching the Z-down
light barrier during the placement cycles.This value is used to calculate the Z down delta
place [µm] (4) value.
15. This diagram illustrates the "Z down delta pick [µm] (3)" values for the segments.
Blue line Z down delta pick [µm]
Red border Min and max tolerances (in our case 0..150µm)
Use the button to zoom in on the diagram.
16. This diagram illustrates the "Z down delta pick min/max [µm] (11,12)" values for the segments.
Blue line Z down pick min [µm]
Green line Z down pick max [µm]
Use the button to zoom in on the diagram.
17. This diagram illustrates the "DP time min/max [ms] (5,6)" values for the segments.
Blue line DP time min [ms]
Green line DP time max [ms]
Red border Min and max tolerances (in our case 100..250ms)
Use the button to zoom in on the diagram.
18. This diagram illustrates the "Z down delta place [µm] (4)" values for the segments.
Blue line Z down delta pick [µm]
Red border Min and max tolerances (in our case 0..150µm)
Use the button to zoom in on the diagram.
19. This diagram illustrates the "Z down delta place min/max [µm] (13,14)" values for the
segments.
Blue line Z down place min [µm]
Green line Z down place max [µm]
Use the button to zoom in on the diagram.