80S-2080F480F5.pdf - 第341页
SIPLACE 80S-20/F4/F5 User M anual 5 Vision Func tions 05/99 Issue from Software Vers ion SR.405.xx 5.6 Test Comp onent Line en gineer 5 - 109 5.6.4. 12 T ransform ... Option When y ou activ ate this opti on the Select co…
5 Vision Functions SIPLACE 80S-20/F4/F5 User Manual
5.6 Test Component 05/99 Issue from Software Version SR.405.xx
5 - 108 Line engineer
5.6.4.11
Ball Illustration
Option
With this option you can change the ball model description.
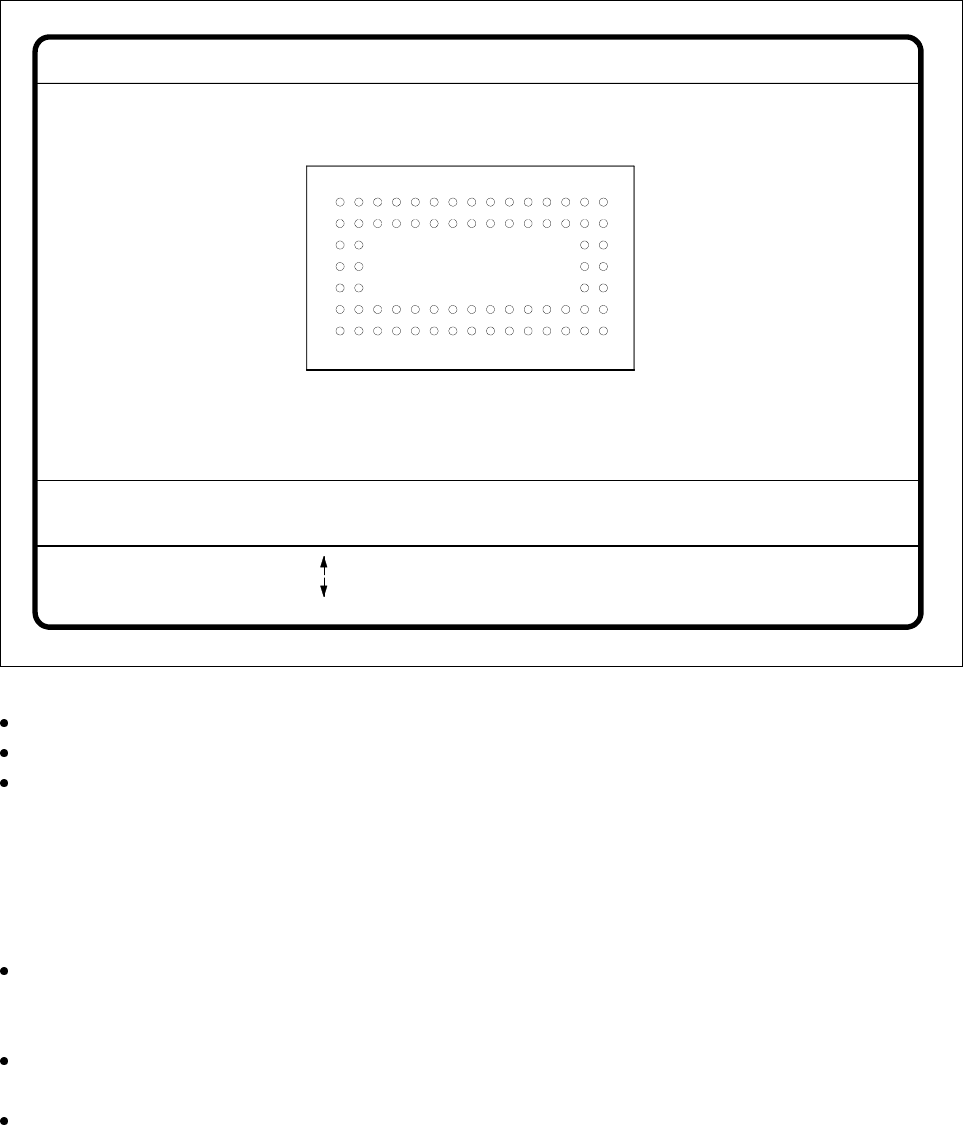
Fig. 5.6.29
Test component
menu,
Ball image
video image
Use the tabulator key to select the ball model.
With the spacebar select the radius type - inner or outer radius.
Use the arrow keys to enlarge or reduce the internal or external radius of the ball. The balls will be dis-
played in their geometric dimensions as a pixel image on the lefthand edge of the video image.
The value of the inner radius the ball shape:
– If the inner radius is equal to 0, the ball will take the form of a circle.
– If the inner radius is greater than 0, the ball will take the form of a doughnut (not frequently used).
Use the
+
or
-
keys to increase or reduce the ball contrast.
Select ball contrast > 0, if the ball is lighter than the background.
Select ball contrast < 0, if the ball is darker than the background.
With the Return key you can trigger the individual measurement steps which are specified in the measure-
ment conditions for the specified component.
Press Esc to cancel the option, even if not all measurement steps have been carried out. You will then be
returned to the Test component menu.
GF no. = 5Ball image
RET: Test comp.
Tab: Ball model
Rad. i.[mm]
Ball model = 1
Rad. e.[mm]
Rad. type: intern./extern.
= 0.500
= 1.500
+ : Contrast +
- : Contrast -
Contrast a.
Contrast i.
= 10
= 20
: larger
: smaller
Blank: Radius type
SIPLACE 80S-20/F4/F5 User Manual 5 Vision Functions
05/99 Issue from Software Version SR.405.xx 5.6 Test Component
Line engineer 5 - 109
5.6.4.12
Transform ...
Option
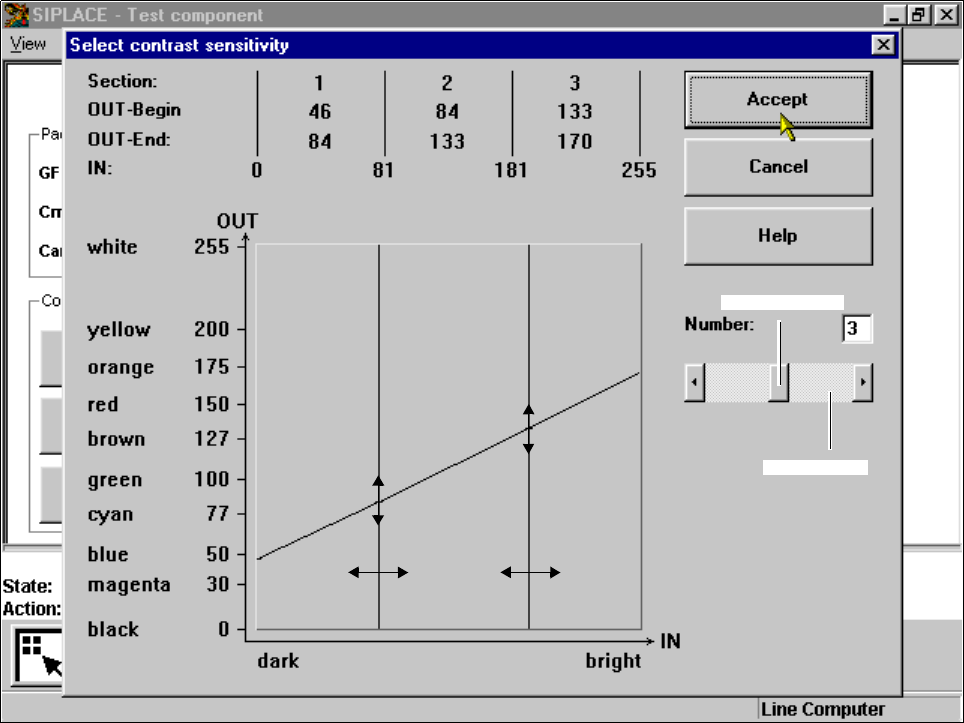
When you activate this option the
Select contrast sensitivity
option box will open.
Fig. 5.6.30
Test component
menu,
Select contrast sensitivity
option box
You can select the following parameters:
– Number of sections which contain the transformation table: number between 1 and 5
– Selection of value pairs: with 5 sections 10 pairs of values are permitted.
Layout of the
Select contrast sensitivity
option box:
Numerical presentation of the table
The numerical values are indicated in the upper part of the option box. These are:
Section: Number of sections
OUT Begin: OUT End: Ranges of values for the transformation of the individual sections
IN: Range limits of the individual sections
Graphic presentation of the table
In the diagram
– the abscissae (x axis) represent the input values range, subdivided into sections.
– the ordinates (y axis) represent the output values with their color allocation.
Scroll bar
Scroll field

5 Vision Functions SIPLACE 80S-20/F4/F5 User Manual
5.6 Test Component 05/99 Issue from Software Version SR.405.xx
5 - 110 Line engineer
Buttons
– Accept
Click on the
Accept
button to save the settings. The option box will then close.
– Cancel
With
Cancel
you can discard the settings. The option box will then close.
– Help
With the
Help
button you can access explanatory material regarding the on-screen presentation.
– Number
input field
You can choose the number of sections
by entering the numerical value directly into the display field, or
by moving the scroll field in the scroll bar to the right or left using the mouse. In this way you can run
back and forth through the values range (1 - 5), or
by clicking on the lefthand or right-hand arrow on the scroll bar. In this way you can increase or
decrease the number of selections.
Programming the transformation table
– Specifying the output values
Position the mouse pointer over the ends of the transformation lines of each section. The ends are marked
with small horizontal lines. A vertical double arrow will then appear on the screen. Click on the lefthand
mouse key and move the arrow upwards or downwards. This will move the selected end of the transforma-
tion line and the numerical value will be displayed at
OUT Begin
or
OUT End
.
– Selecting the section limits
The graphical representation in Fig. 5.6.30, Page 5 - 109 shows section limits with the ranges 0 - 80, 81 -
180 and so on. You can change these section limits if you wish. However limits 0 and 255 are permanently
allocated and cannot therefore be moved.
Position the mouse pointer on a section limit (but not 0 and 255). A horizontal double arrow will appear on
the screen. Hold down the lefthand mouse pointer and use it to drag the section limit in the direction you
want. The corresponding numerical value will be displayed at
IN:
.
– Once you have programmed your transformation table you can quit the option box by clicking on
Accept
or
Cancel
.
Notes on using the transformation tables to set the contrast sensitivity
– Select up to 3 sections.
– The range of values for the individual sections should be at least 75.
– Program the ranges so that no jumps occur at the range limits.
Set the contrast sensitivity so that the shape of the curve roughly corresponds to one of the three following
examples: