3OM-1343-008_w.pdf - 第206页
5-21 AKFEDT -ID 2.4 Handling/Placement Data When the "Handling/Plac. Data" tab is pressed in the "Management Data" window , the following tab sheet appears inside the window . Fig. 3E1 1 "Handlin…

5-20
AKFEDT-ID
(11) Rate of Error (%)
Each text box shows the percentage of the total number of errors per the
number of picked components.
(12) Nozzle Clear/Change Date
Each text box shows the clear date for each individual nozzles.
Note
When one of the above buttons is pressed, the nozzle No. with the biggest
parameter under the selected button is displayed in the fi rst line and nozzle
Nos. having the subsequent (second, third, fourth, ...) biggest parameters
follow.
That is, parameters are re-arranged in order of error counts, making it easy
to analyze and improve production rate.
When the [Noz.] button is pressed, the Nos. are re-arranged in their initial
order (Nozzle Nos.).
0607-003
2.3 Nozzle Management Data
5-21
AKFEDT-ID
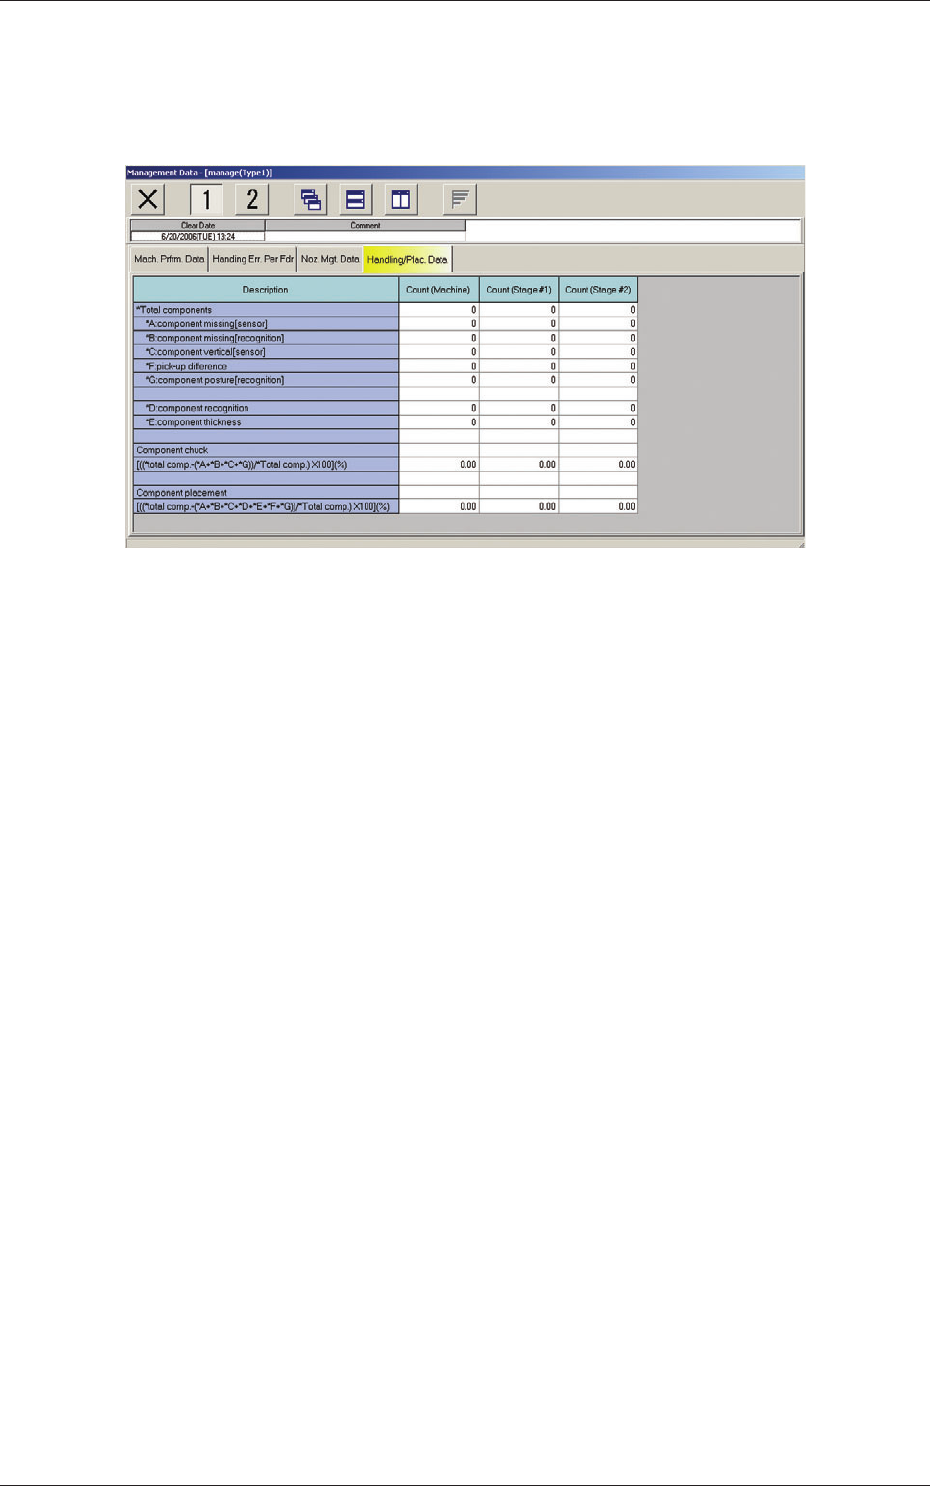
2.4 Handling/Placement Data
When the "Handling/Plac. Data" tab is pressed in the "Management Data"
window, the following tab sheet appears inside the window.
Fig. 3E11 "Handling/Plac. Data" Tab Sheet
(1) *Total components
Shown is the number of component picks.
*A component missing [sensor]
Shown is the number of component missing errors detected by the
component linear measure detection sensor.
(Case: "NG" (No Good) in Component Recognition and Linear
Measure Detection Sensor)
*B component missing [recognition]
Shown is the number of component missing errors detected through
component recognition operation.
*C component vertical [sensor]
Shown is the number of components judged "NG" (No Good) by
the linear measure detection sensor although they are judged "OK"
through component recognition process.
*F pick-up difference
Shown is the number of components judged "NG" (No Good)
through recognition process.
*G component posture [recognition]
Shown is the number of reversed component and polarity judgment
errors detected in the recognition process.
*D component recognition
Shown is the number of components judged "NG" (No Good)
through recognition process.
*E component thickness
Shown is the number of errors in component thickness detected by
the linear measure detection sensor.
0607-003
2.4 Handling/Placement Data
5-22
AKFEDT-ID
(2) Component chuck
[((*total comp.-(*A+*B+*C+*G))/*Total comp.)
×
100] (%)
The value (%) is determined by the following formula.
# of Picks - (Counts in "A" + Counts in "B" + Counts in "C"+ Counts in "G")
×
100
# of Picks
(3) Component placement
[((*total comp.-(*A+*B+*C+*D+*E+*F+*G))/*Total comp.)
×
100] (%)
The value (%) is determined by the following formula.
# of Picks - (Counts in "A" + Counts in "B" + Counts in "C"
+ Counts in "D"+ Counts in "E"+ Counts in "F"+ Counts in "G")
×
100
# of Picks
Note
About Data Counting (Counting of "*A: component missing [sensor]"
and "*B: component missing [recognition]")
The machine stops in an error condition according to the number of times
(the number of continuous component missing errors to be counted to stop
the machine in an error condition) set in the "1" text box of "Error process"
in the "Control Data" tab sheet of a "Component Library" window. In this
case, the number of missing component errors is not added to the number
of picks and the number of chuck errors.
0607-003
2.4 Handling/Placement Data