3OM-1343-008_w.pdf - 第216页
5-31 AKFEDT -ID F: pick-up diff (% of T otal handling errors) Shown are the number of pickup difference errors detected in the recognition process and the percentage of the errors per total number of pickup errors. G: co…

5-30
AKFEDT-ID
(13) Maintenance time
Shown is the period of time during which the [SETUP] button on the
main menu bar is pressed.
(14) Warm-up run (Test Mode) time
The running time is counted when the machine is operated under the
following condition.
•
"Test Mode" is enabled in the "OPERATION MODE" window.
•
The "PCB Transfer Dsbl." check box is ticked.
(State in which no PCB is put in and out)
(15) Test mode time
Shown is the period of time during which test run was performed
according to the test mode parameters.
(16) Total handling errors/Total components
Shown are the total number of pickup errors, the total number of
components to be picked up, and the percentage of picked components
per total number of pickup errors.
A: comp. missing (% of Total handling errors)
Shown are the number of component missing errors detected by the
linear measure detection sensor and the percentage of errors per total
number of pickup errors.
B: comp. missing (% of Total handling errors)
Shown are the number of component missing errors detected in the
recognition process and the percentage of errors per total number of
pickup errors.
C: comp. vertical (% of Total handling errors)
Shown are the number of vertical component errors detected by
the linear measure detection sensor and the percentage of vertical
component errors per total number of pickup errors.
D: comp. recog (% of Total handling errors)
Shown are the number of errors detected in the recognition process and
the percentage of errors per total number of pickup errors.
E: comp. thick (% of Total handling errors)
Shown are the number of component thickness errors detected by the
linear measure detection sensor and the percentage of errors per total
number of pickup errors.
3.2 Machine Performance Data
0607-003

5-31
AKFEDT-ID
F: pick-up diff (% of Total handling errors)
Shown are the number of pickup difference errors detected in the
recognition process and the percentage of the errors per total number of
pickup errors.
G: component posture (% of Total handling errors)
Shown are the number of reversed component and polarity judgment
errors detected in the recognition process and the percentage of the
errors per total number of pickup errors.
Total handling errors
Shown is the total number of component handling errors.
Zones 1 through 5
1point errors (% of Total PEC recog. errors)
Shown are the total number of errors detected on the fi rst fi ducial
mark and the percentage of the detected errors per total number of
all errors detected by the PEC recognition function.
2point errors (% of Total PEC recog. errors)
Shown are the total number of errors detected on the second fi ducial
mark and the percentage of the detected errors per total number of
all errors detected by the PEC recognition function.
3point errors (% of Total PEC recog. errors)
Shown are the total number of errors detected on the third fi ducial
mark and the percentage of the detected errors per total number of
all errors detected by the PEC recognition function.
Local fi ducial errors (% of Total PEC recog. errors)
Shown are the total number of recognition errors in each individual
components and the percentage of the detected errors per total number
of all errors detected by the PEC recognition function.
Total PEC recognition errors
Shown is the total number of errors detected by the PEC recognition
function.
The total number of errors detected by the global PEC recognition
function and the BBR recognition function are displayed.
3.2 Machine Performance Data
0607-003
5-32
AKFEDT-ID
0607-003
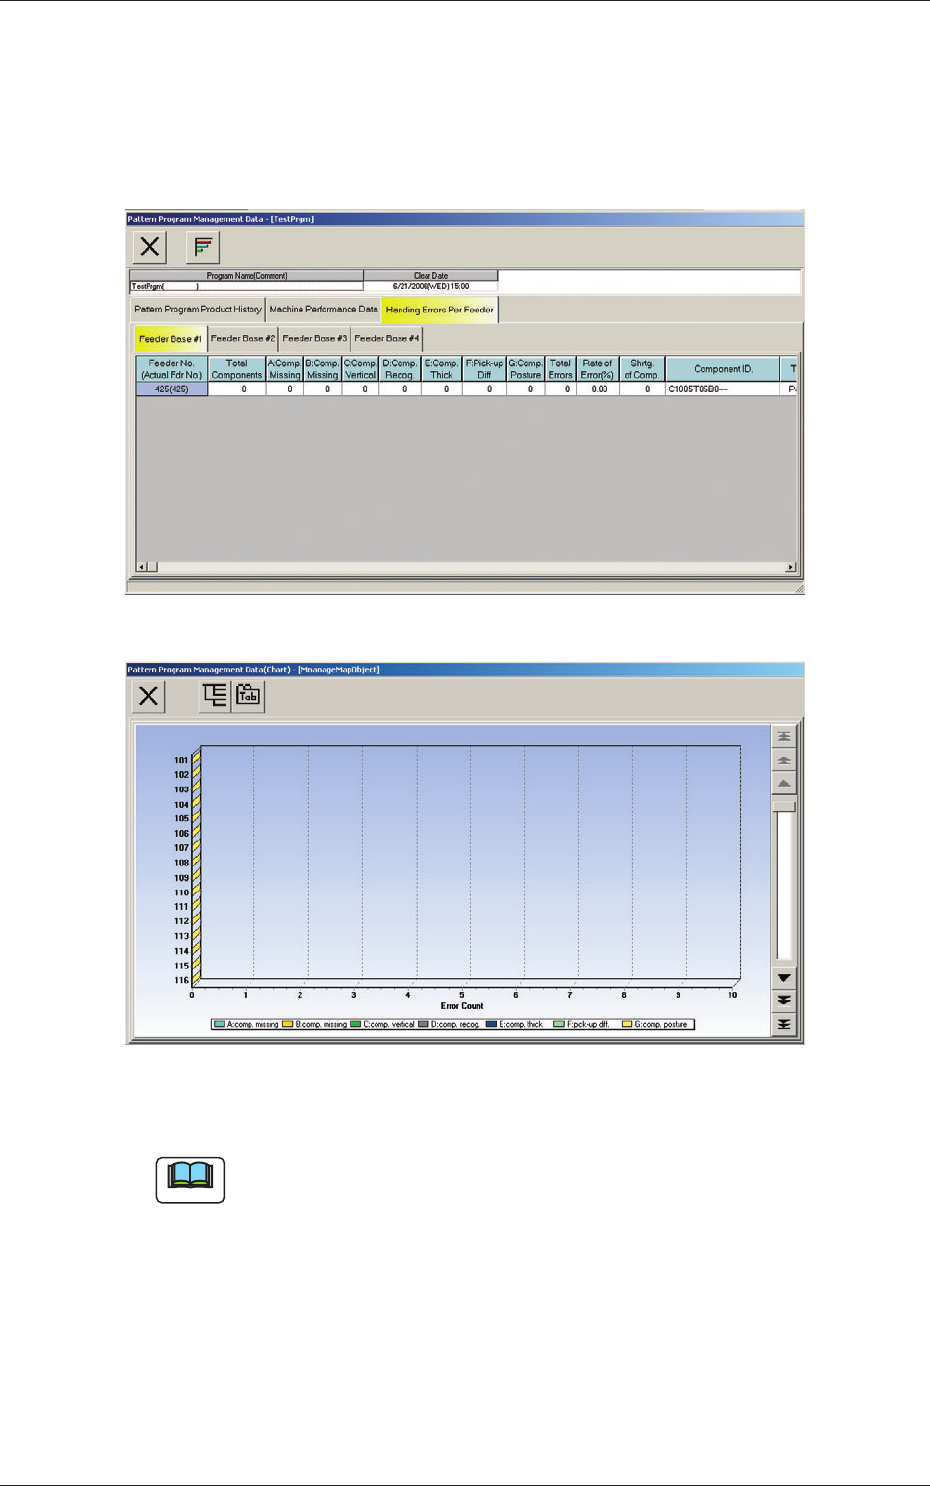
3.3 Handling Errors Per Feeder
3.3 Handling Errors Per Feeder
When the "Handling Error Per Feeder" tab is pressed in the "Pattern Program
Management Data" window, the following tab sheet appears inside the
window.
Fig. 3E15 "Handling Errors Per Feeder" Tab Sheet
Fig. 3E15-1 "Pattern Program Management Data (Chart)" Window for
"Handling Errors Per Feeder"
Note
The displayed tab sheet will look different, depending on which option is
selected.
The corresponding tab sheet enables the operator to view the handling errors
on each individual feeders of the production model.
The "Handling Errors Per Feeder" tab sheet is divided further into several
tabs and each tab sheet shows the handling errors per feeder on each
individual feeder bases.
When a tab is pressed, the corresponding tab sheet appears, indicating that
the related feeder base is selected.