[Superset] Chapter5_SPC Plus_ENG_20100827TW - 第29页
Programmer's Manual | 29
Programmer's Manual | 28
Category Description
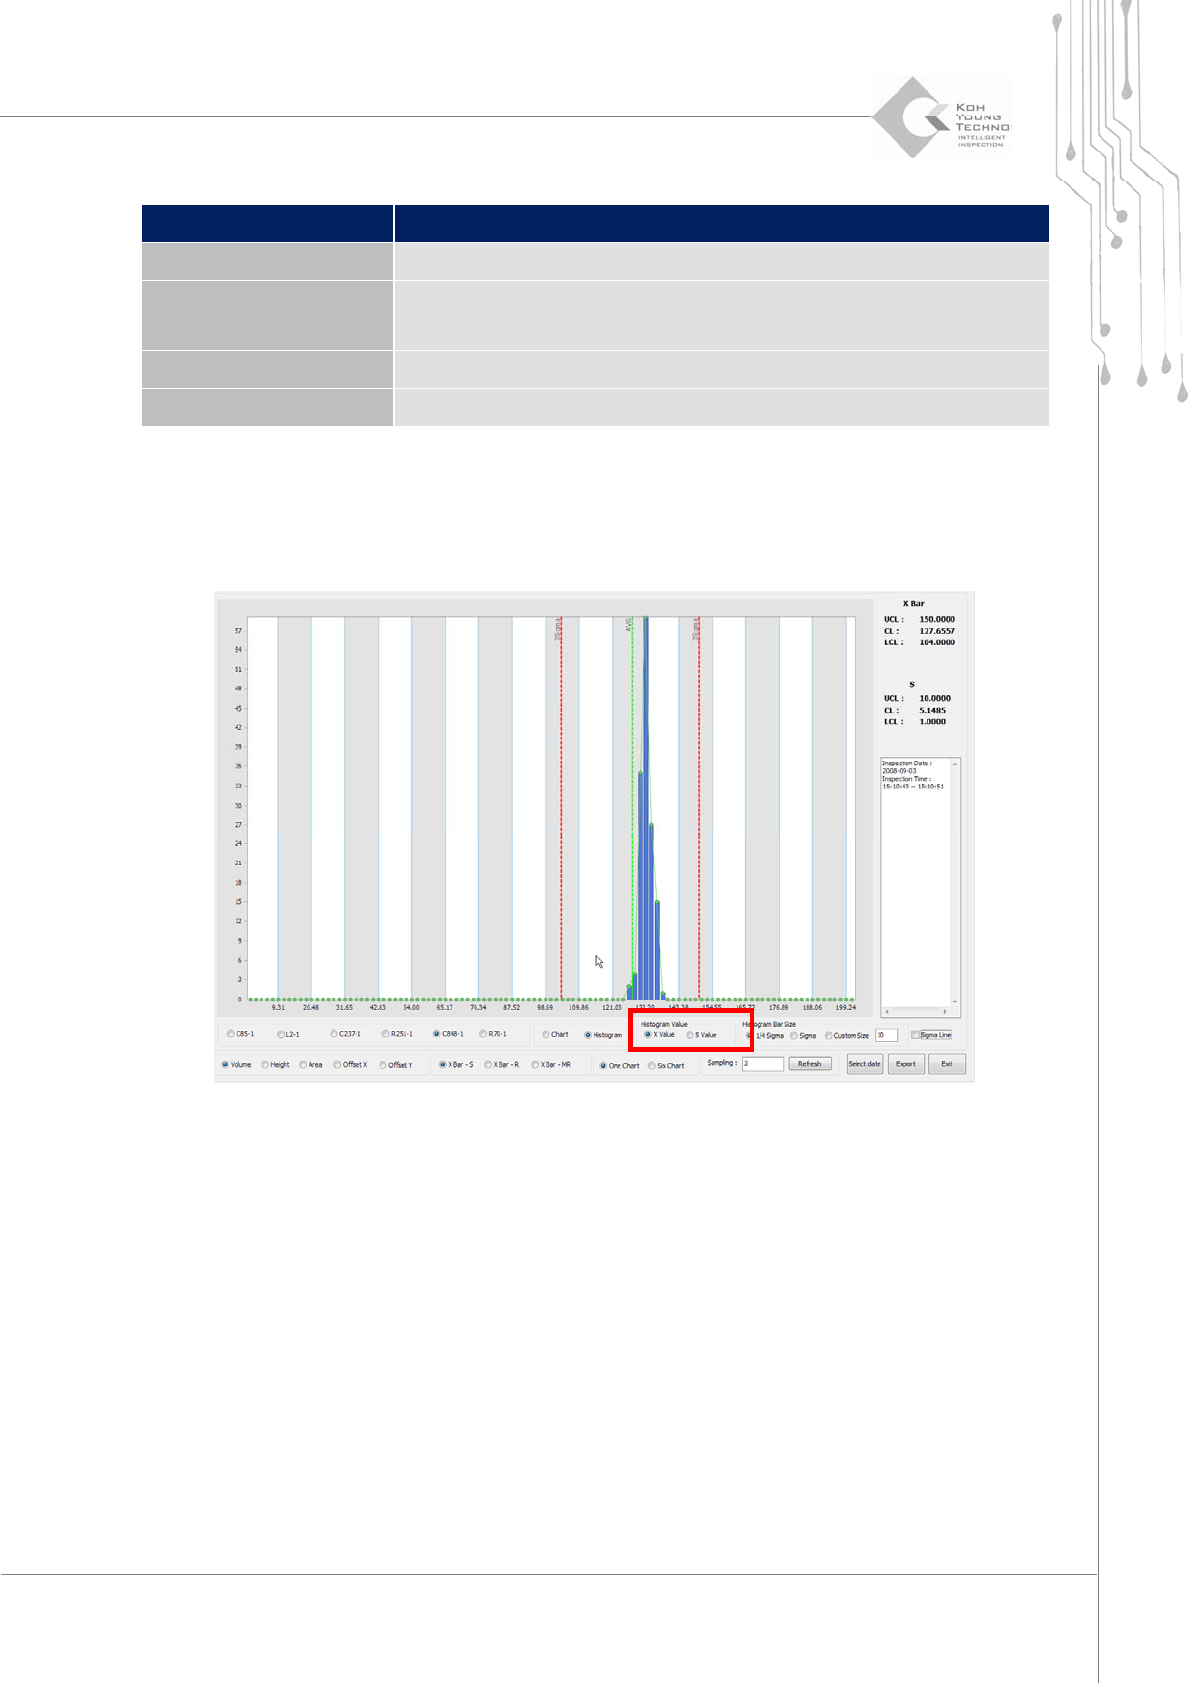
Chart/Histogram Selects viewing either in chart or histogram
Histogram Value
From the X Value and S Value, selects a corresponding category
X Value: Volume, Area, and Height value
S Value: Standard deviation
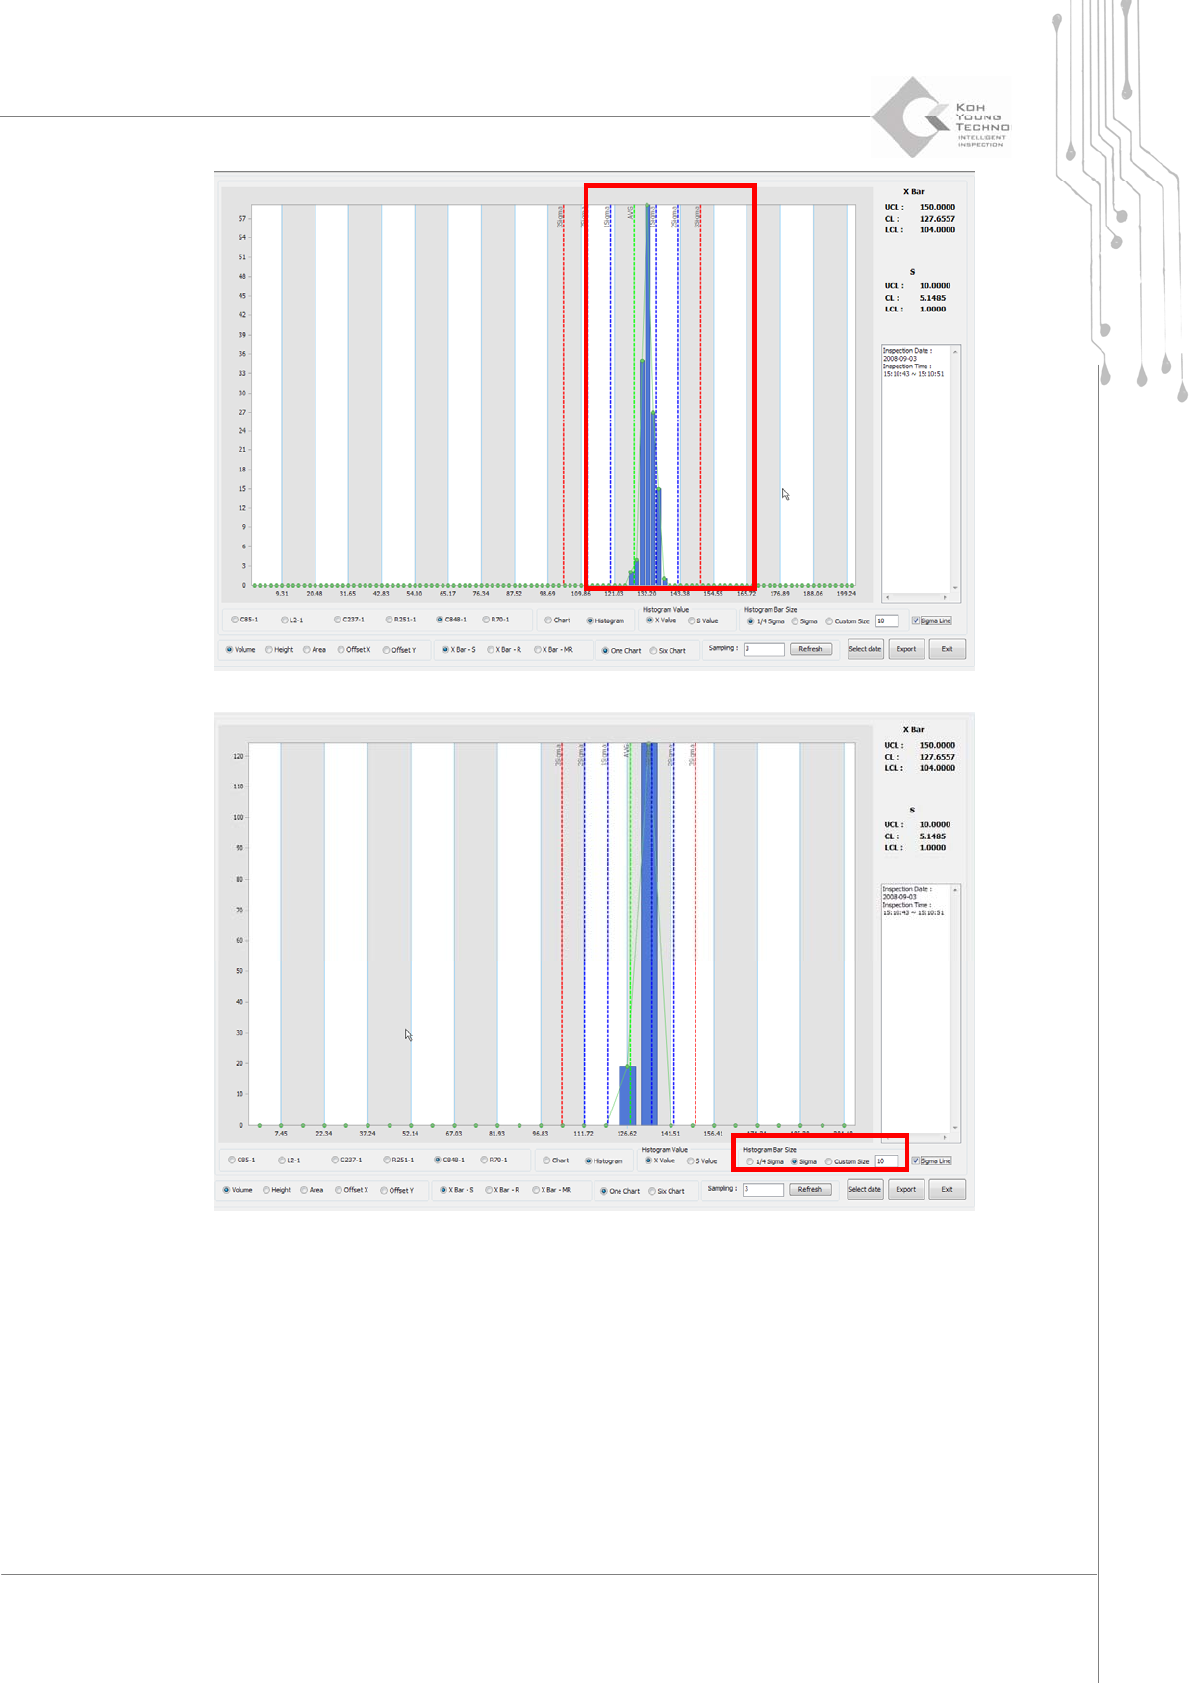
Histogram Bar Size Selects the range of histogram
List Export Saves the currently displayed chart values in file format
ToaddanXVALUEoranSVALUEHistogram,proceedwiththefollowing:
1. Select Histogram from the selection window at the bottom of MRT Chart screen.
2. From X Value and S Value, select the desired category.
Programmer's Manual | 29
Programmer's Manual | 30
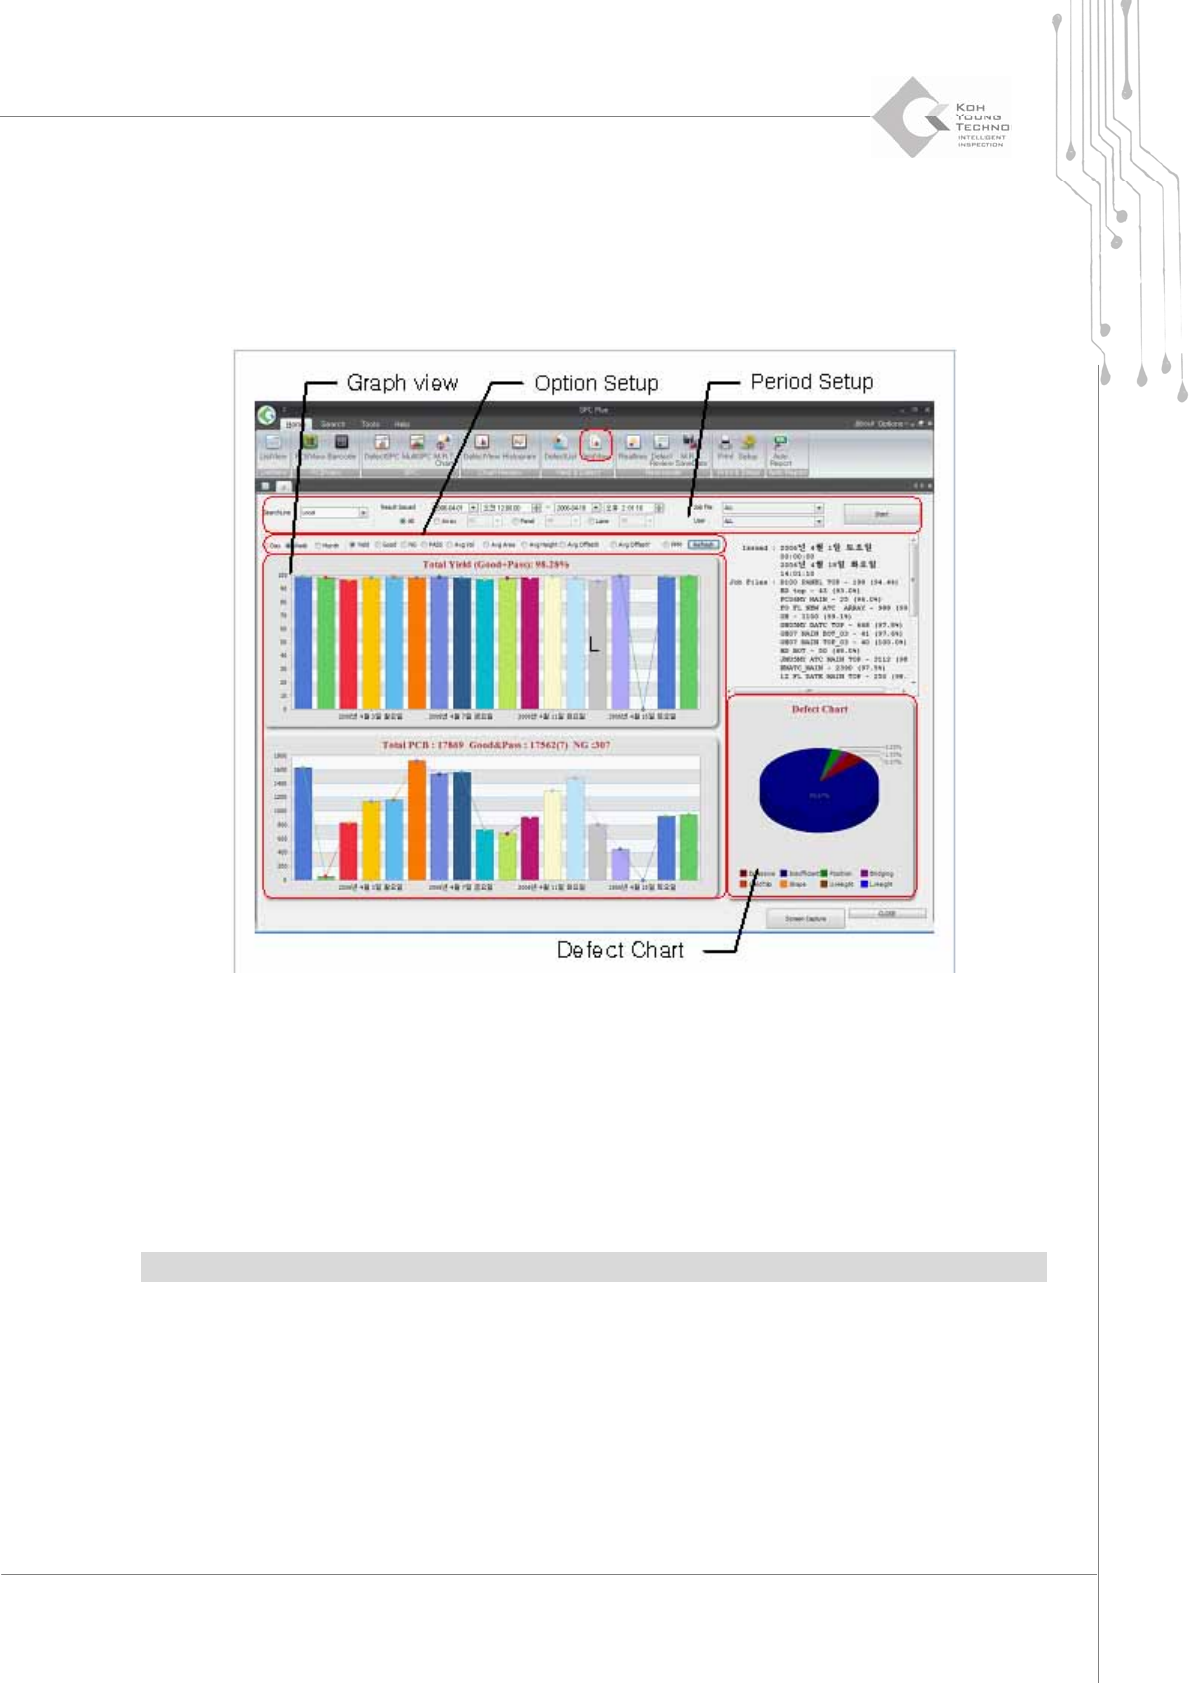
3.7. YieldView
YieldViewisthefunctionofdeterminingtheworkefficiencyofacertainperiod.Itisusedtoobtain
thestatis t i cs ofyieldrate,average offset,orNGquantityofacertainperiod.
Figure 3-12. YieldView
Enter a period and other settings in the period setup and click the <Start> button. The
productionindexofthecorrespondingPCBwillappear.
Changing the display period or contents in option setting and clicking the <Reconfirm>
buttonwillchangethegraphinGraphview.
DefectChart
displaysthedefectdeterminationbytheconfigured PCBasapiegraph.
Note:YieldViewcanhandlethestatistic s ofuptoone‐monthperiod.