N7201A616E00_0317.pdf - 第247页
NPM-W 2 EJM7DE-MB-03 O-00 3-2-10 -2 C A B D E F G No Data number. Rec-Area Displays the total area value in recognition. (Un it : mm 2 ) Data-Area Displays the reference area value. (Unit : mm 2 ) TBL (table) The table o…
NPM-W2 EJM7DE-MB-03O-00
3-2-10-1
C
A
B
D
E
F
G
Produc-
tion
informa-
tion
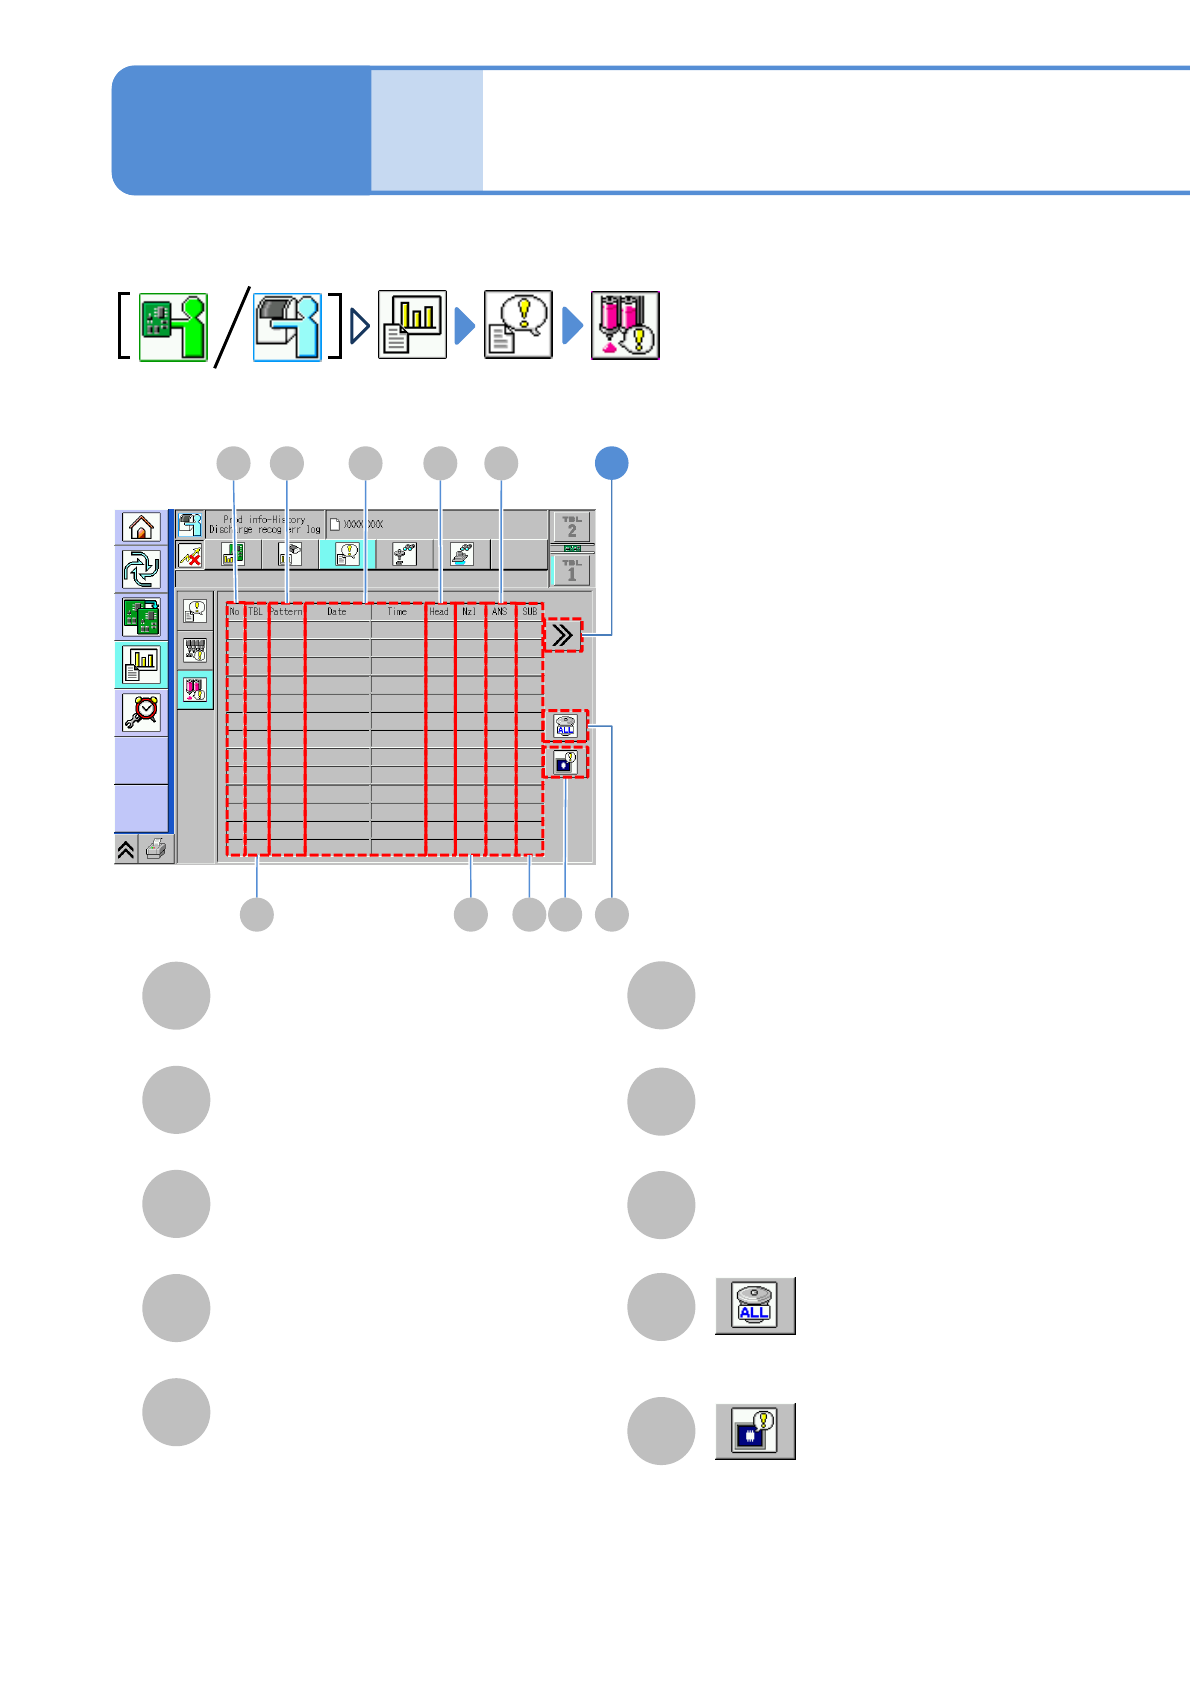
No
Data number.
Head
Displays the head with error.
I
J
Date/Time
TBL (table)
The table on which the error occurred.
ANS
Displays the recognition error code.
Clears all the dummy dispensing
recognition error histories.
Transitions to the image data
save screen
Dummy dispensing
recognition error history
(dispensing head)
IB J
DC E GA
1
Pattern
Displays the dummy dispensing pattern.
The latest fifty records of dummy dispensing recognition errors that occurred in automatic operation mode are
displayed.
F H
Nozzle
Nozzle number with error.
H
SUB
Displays the recognition error sub-code.
Operating procedure
3-2-10
NPM-W2 EJM7DE-MB-03O-00
3-2-10-2
C
A
B
D
E
F
G
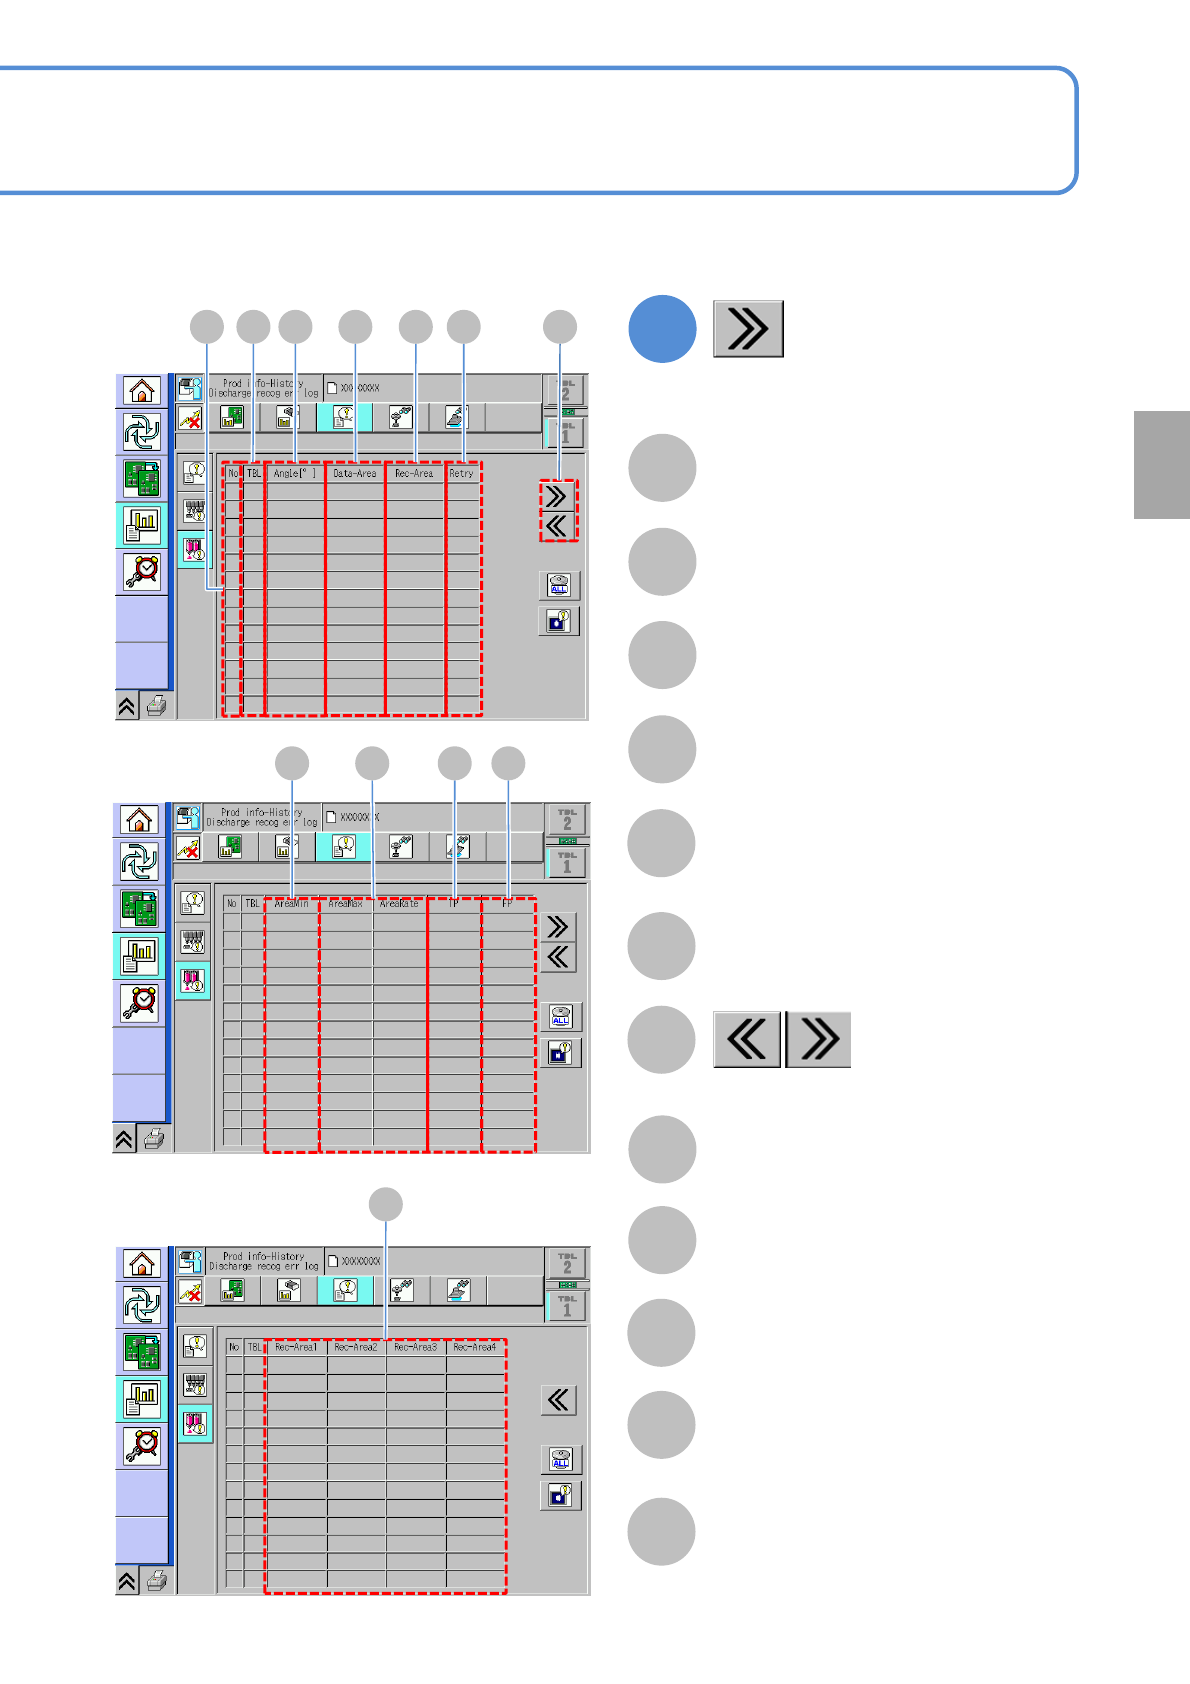
No
Data number.
Rec-Area
Displays the total area value in
recognition. (Unit:mm
2
)
Data-Area
Displays the reference area value.
(Unit:mm
2
)
TBL (table)
The table on which the error occurred.
Retry
Displays the number of times of
recognition retry.
Angle[° ]
Displays the recognition angle.
A C D E F G
1
(Error detail information is
displayed)
Shows the previous or next screen.
B
H I J K
L
H
I
J
K
TP
Displays the stringiness judgment
value. (Unit: mm
2
)
AreaRate
Displays the limit of the large/small area
ratio.
FP
Displays the diameter of the skipped
Pattern (Unit: mm
2
)
AreaMin/AreaMax
Displays the lower/upper limit of the total
area. (Unit:%)
L
Rec-Area1 to 4
Displays the area of the individual
pattern 1 to 4. (Unit: mm
2
)
Production
NPM-W2 EJM7DE-MB-03O-00
3-2-11-1
Produc-
tion
informa-
tion
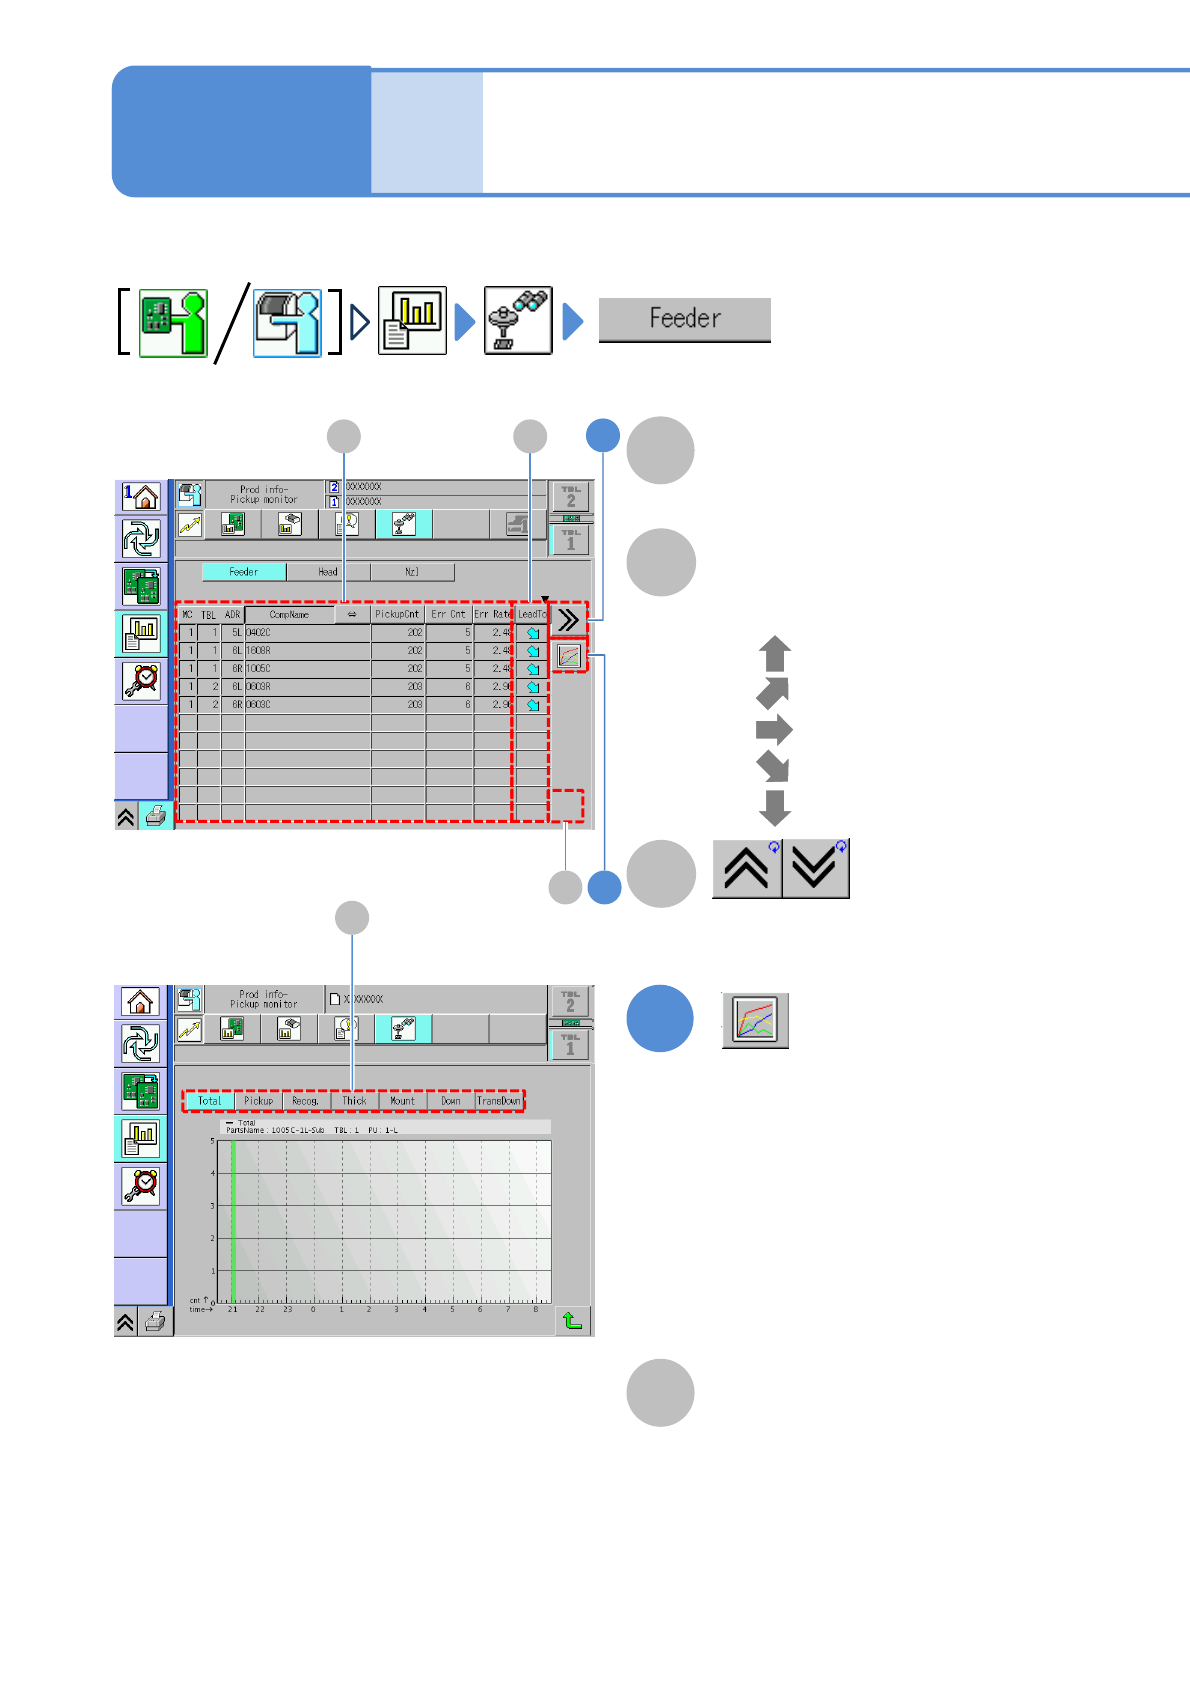
Feeder pickup monitor
1
You can check feeder component information per feeder address.
A
Pickup information per feeder
(→P.3-2-1-8)
B
LeadTo
Displays increase or decrease tendency
of the error rate.
●
●
●
●
●
: Ultra up tendency
: Up tendency
: Constant tendency
: Ultra down tendency
: Down tendency
Shows the previous or next table.
C
(Displays component error count in a
graph)
D
●Error count of the selecting feeder
per hour is displayed on the graph.
Vertical axis: Error count
Horizontal axis: Time
●Choosing the total error or an error
item can change the display of the
graph
D
Total error and error item
(→ P.3-2-3-2)
Operating procedure
3-2-11
C
A
2
B
1