semi合集-English.pdf - 第1412页
SEMI E30-1103 © SEMI 1992, 2003 86 3rd and last transm ission <L,4> 1. ABCD 2. 9 3. 88 05 01 01 09 00 hr min 4. <L,6> 71 0.30 72 0.30 71 0.31 A.5 Harel Notation Harel’s statecharts extend tradition al state-t…
SEMI E30-1103 © SEMI 1992, 2003
85
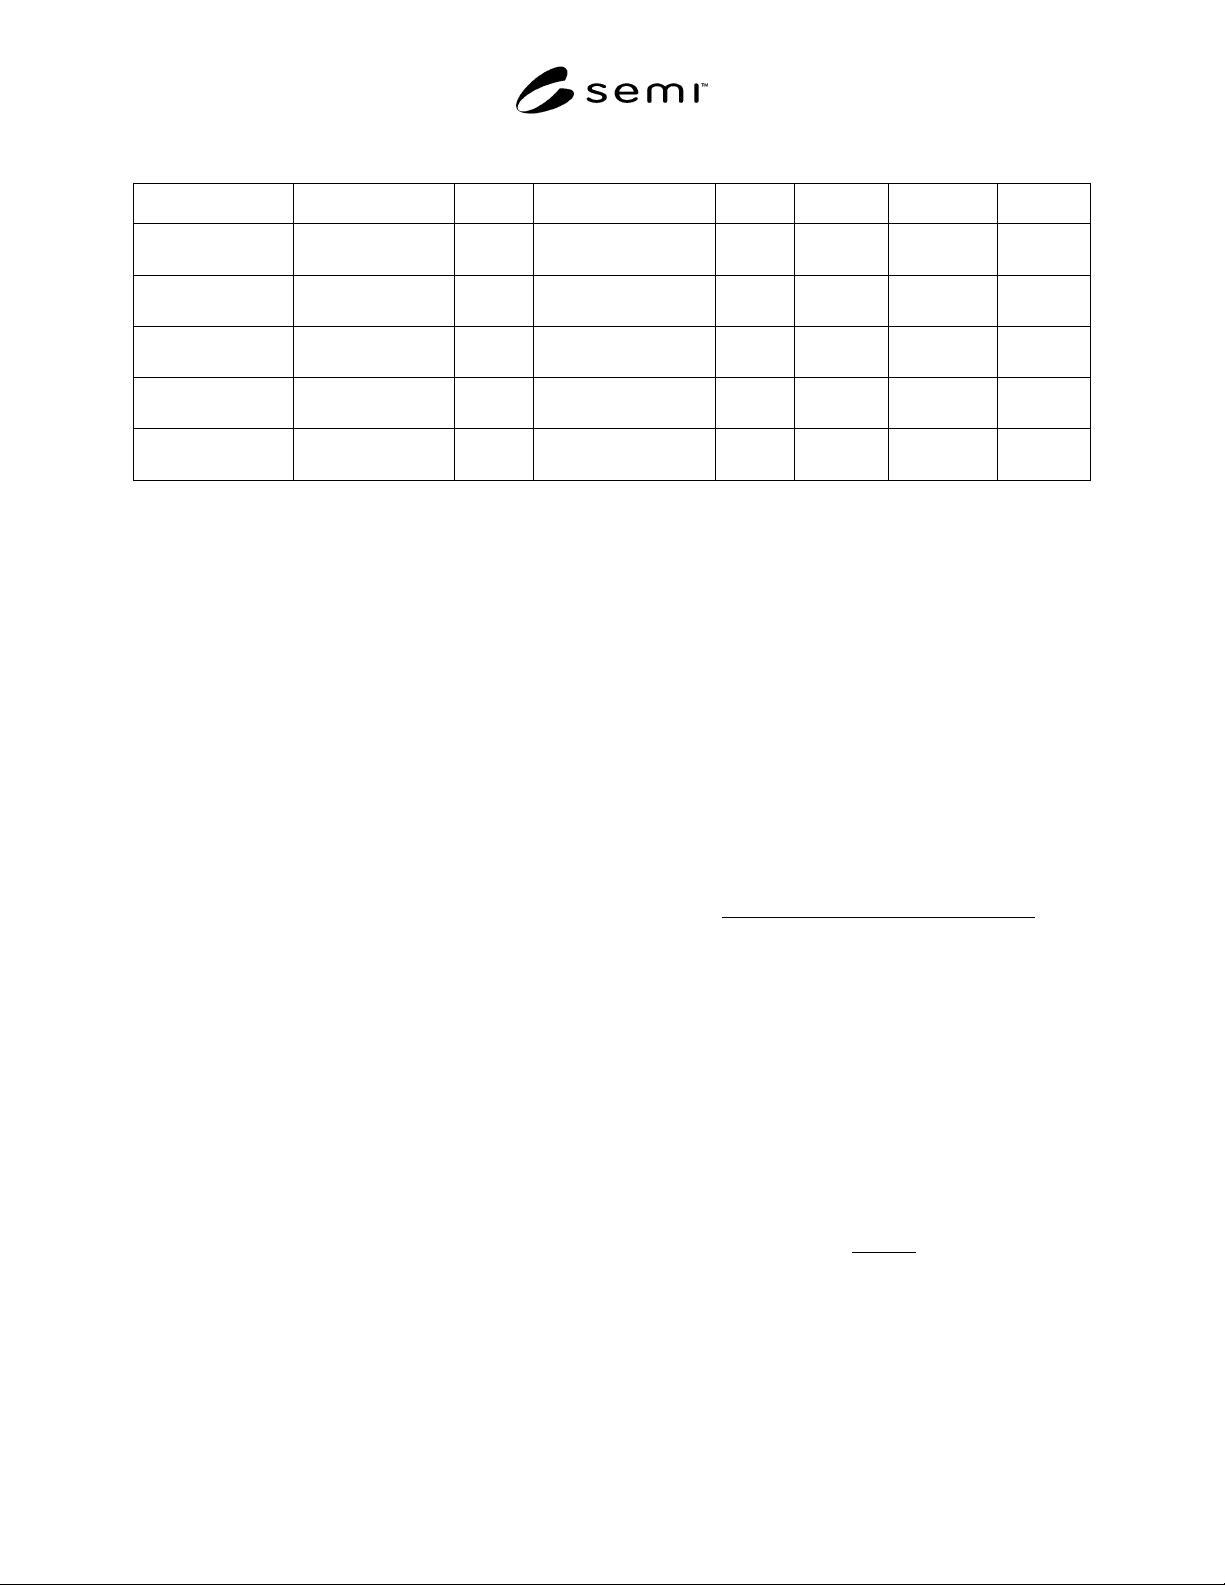
Table A.3 Alarm Examples Per Equipment Configuration
Subsystem Alarm Description ALID Trigger Reset Operator Equipment Material
Mainframe Power
Supply
Overvoltage Voltage supply over
maximum limit
X
Undervoltage Voltage supply under
minimum limit
X
Internal Power
Distribution Bus
AC Low AC under minimum
limit
X X
Cooling System Overtemp Temperature over
maximum
X X
Pressure Low Pressure below
minimum
X
Subsystem The subsystem of the equipment to which the alarm is related
Alarm Description Description of the alarm
ALID The Alarm ID as specified by SECS-II
Trigger Text description of what caused the alarm
Reset Description of how to resolve the alarm condition
Affected Who or what is affected by the alarm trigger: Operator, Equipment, and Material
A.4 Trace Data Collection Example
This example shows an implementation of the Trace
Data Collection capability defined in Section 4.2.3.
S2,F23 sent by host:
TRID = ABCD
DSPER = 000100 (One minute per
period)
TOTSMP = 9
REPGSZ = 3
SVID1 = Temperature
SVID2 = Relative humidity
S6,F1 looks like this (starting at time 1 a.m.):
1st transmission <L,4>
1. ABCD (trace ID)
2. 3 (last sample of the
transmission)
3. 88 5 01 01 03 00
Year Month Day Hour Min Sec
4. <L, n> n = 2 SVID‘s x REPGSZ of
3 = 2 x 3 = 6
72 (temperature)
0.29 (relative humidity)
73 (temp.)
0.30 (r.h.)
71 (temp.)
0.30 (r.h.)
2nd transmission <L,4>
1. ABCD
2. 6
3. 88 05 01 01 06
00
hr min
4. <L,6>
73
0.31
71
0.32
71
0.31
SEMI E30-1103 © SEMI 1992, 2003
86
3rd and last transmission <L,4>
1. ABCD
2. 9
3. 88 05 01 01 09
00
hr min
4. <L,6>
71
0.30
72
0.30
71
0.31
A.5 Harel Notation
Harel’s statecharts extend traditional state-transition
diagrams with several additional concepts, most
important of which are hierarchy and concurrence.
Statecharts depict the behavior of a system by showing
states it may take, events that prompt a change of state,
and the composition of states. What follows is a very
brief description of the symbols defined for use and
how these are useful to describe a system. See Figure
A.5.1 for the basic notational symbols.
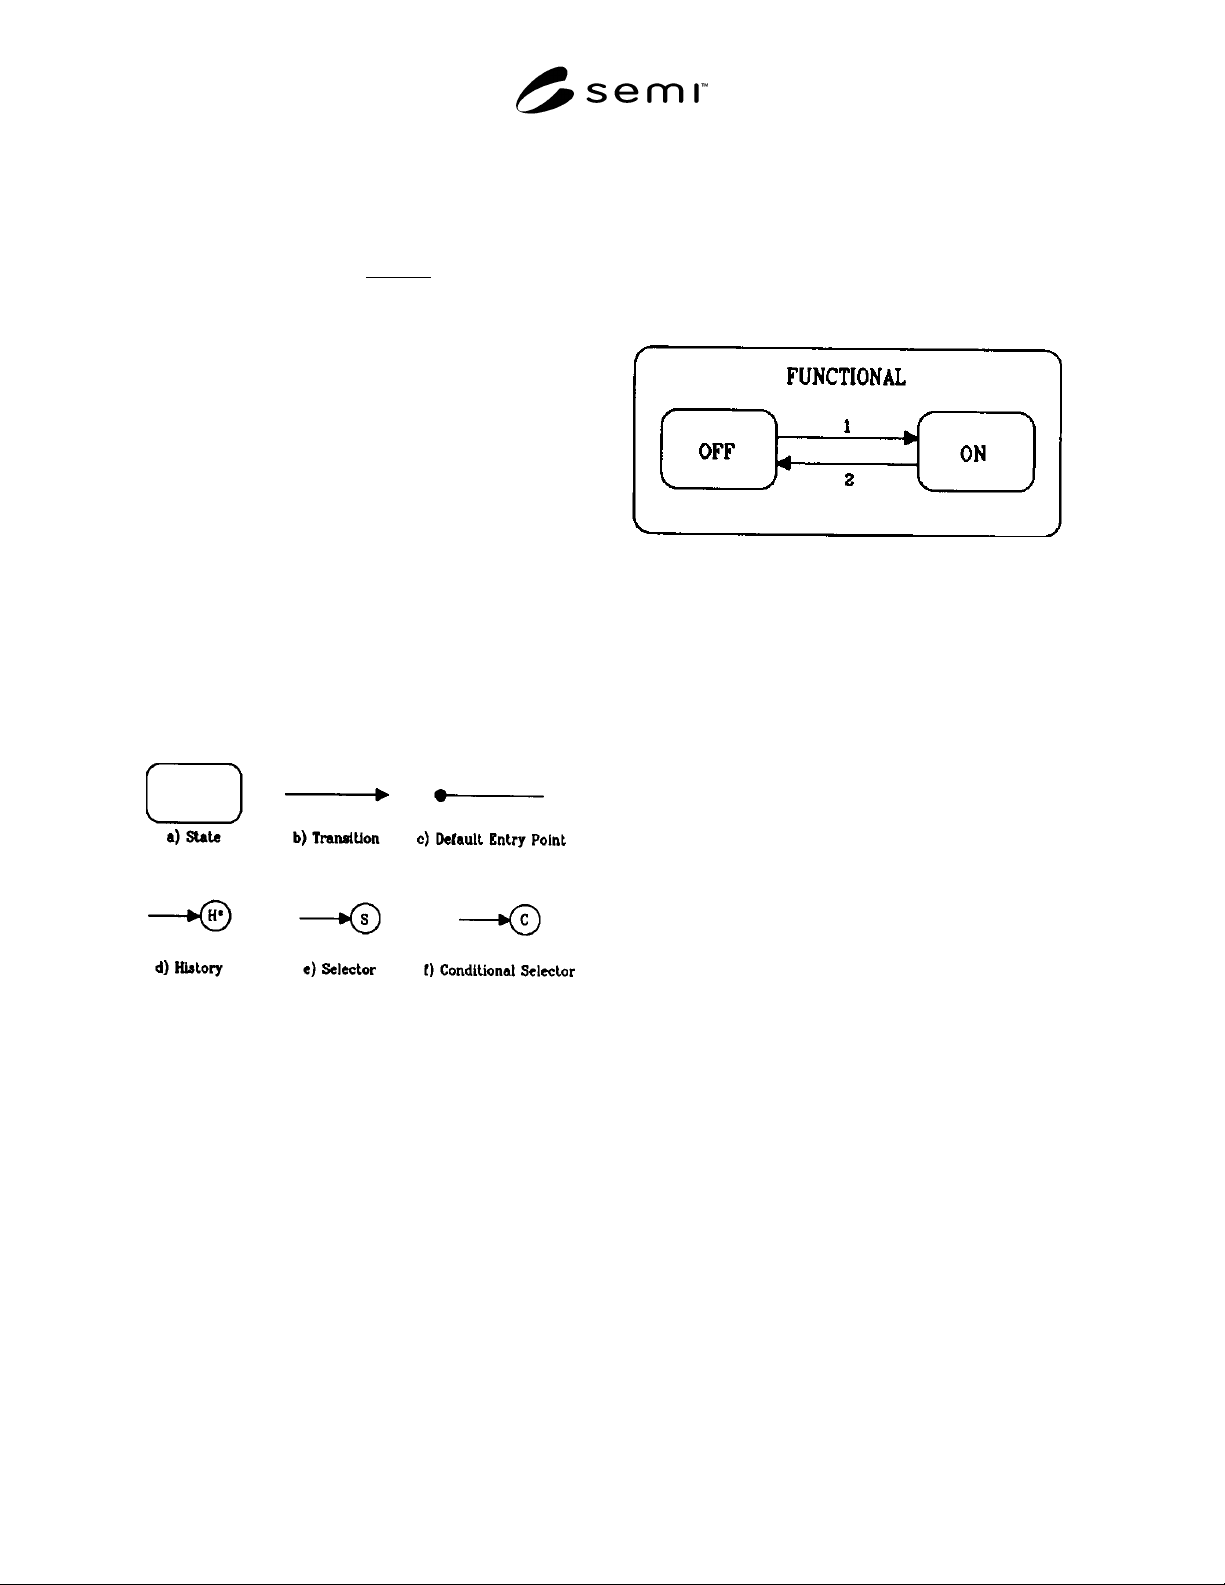
Figure A.5.1
Harel Statechart Symbols
States are represented by rounded boxes. A state
transition is shown graphically with a line from the old
state terminating with the arrow symbol at the new
state. Transitions are unidirectional-while the reverse
transition may be possible, it is considered a different
transition with different conditions for initiation and
different resultant actions.
States may be subdivided into substates to facilitate
more concise definition of behavior. Thus, a hierarchy
is defined whereby any state may be a substate of some
parent state and in turn be the parent of its own
substates. Substates must be one of two types, termed
AND substates and OR substates.
A parent maybe divided into two or more OR substates
of which one and only one is the active substate at any
time. The accepted term for this exclusivity is XOR.
Figure A.5.2 gives an example of a simple case of OR
substates. In this example, some system (perhaps a
motor) has a state named FUNCTIONAL. When the
motor is FUNCTIONAL, it may be either ON or OFF,
but never both.
Figure A.5.2
Example of OR Substates
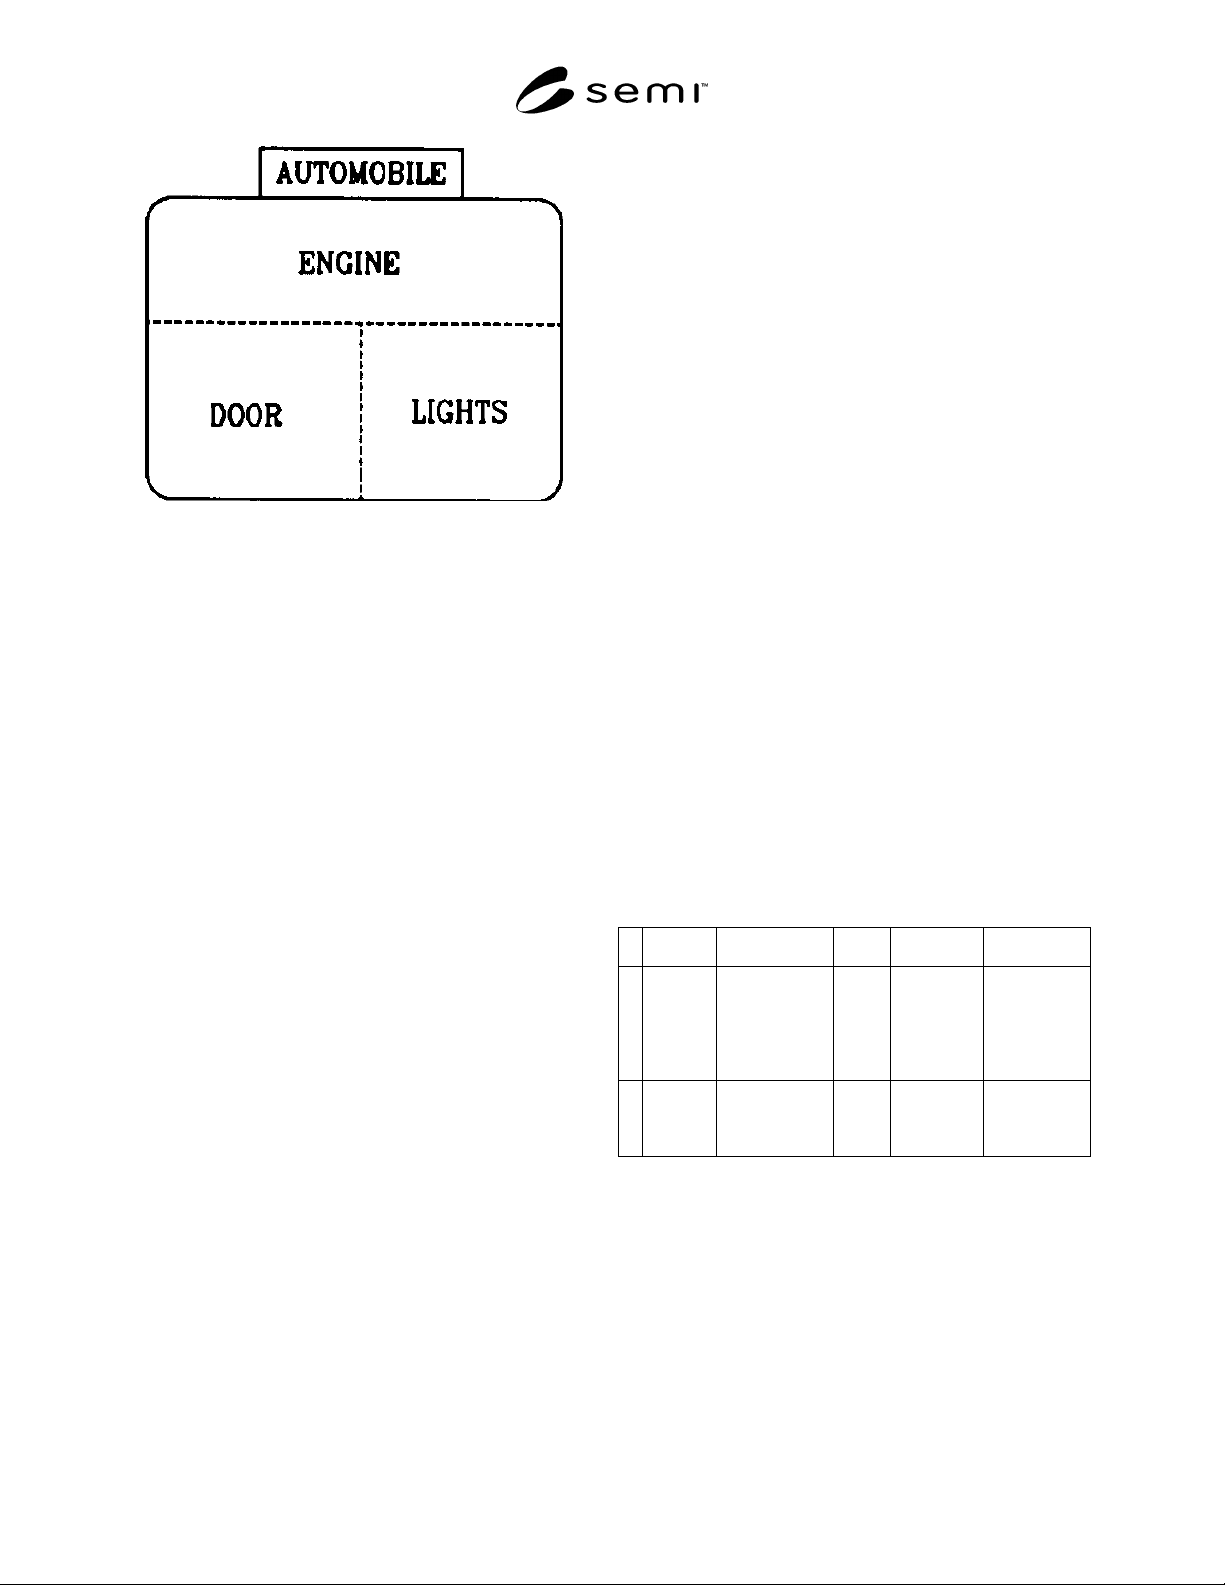
Another way of dividing a parent state corresponds
roughly to subsystems. These AND substates represent
parallelism, such that every AND substate of an active
parent state is considered active. Harel also uses the
term “Orthogonal Component” to refer to AND
substates. However, these parallel substates tend to be
highly interactive and interdependent. For this reason,
the word orthogonal is considered confusing and has
been excluded from use in this document. Figure A.5.3
shows an example of AND substates representing (in
part) an automobile. Note the convention of attaching
the name of the parent state AUTOMOBILE to the
outside of the state in a small box. The substates shown
are independent components and may have their own
substates (of either the AND or OR type):
— LIGHTS may be ON or OFF;
— DOOR may be OPEN or CLOSED;
— ENGINE is constructed of components such as
pumps, pistons, carburetor, etc.
Exiting one of a set of AND substates requires the exit
of all others. In some cases, a transition arrow will be
shown from only one of the substates with the others
implied.
SEMI E30-1103 © SEMI 1992, 2003
87
Figure A.5.3
Example of AND Substates
A simplification that also helps to prevent in
determinacy is implemented with the symbol for default
entry point. This symbol will indicate which OR
substate is initially active when there is not an explicit
choice. This lack of specification is indicated by a
transition arrow from one state to another that does not
cross the boundary of the parent to point specifically to
a substate.
An entrance to a state terminating in a history symbol
(see Figure A.5.1) indicates that the OR substate to be
entered should be that which was active the last time
the parent state was active (i.e., last time the car was
running, the radio was on). The history symbol H refers
to the choice of substates of the parent. The symbol H*
extends further to the lowest level substates defined. In
the absence of memory of a “last time”, the default
entry is used.
The selector and conditional selector symbols serve to
abbreviate complex entrances to states. Their meaning
is similar and indicate that the choice of OR substate
upon entry of a parent state depends on some condition
that is not shown. The selector is usually used to
combine several similar transition events, while the
conditional selector will typically require some
computation or test of conditions external to the
stimulus for state transition. Please examine the
referenced article for more detail.
NOTE: Within the body of this document, the
term statechart is not used in favor of the more
traditional term state diagram.
A5.1 State Definitions –– The state diagram provides a
concise description of the function of a system.
However, a full definition requires detail that cannot be
included on the diagram. A description of each state is
required that covers the boundaries of the state and any
responses that occur within that state to the
environment. The convention in this document is to
provide state names in ALL CAPS to help the reader
identify where these are used. A sample state
description of the ON state depicted in the Figure A.5.2
might be:
ON
The switch is in the on position. Power is available to
the motor. Speed of the motor will change in proportion
to the speed knob adjustment.
A5.2 Transition Table –– The last piece of the state
model is the transition table. It consists of several
columns that list the transition number from the
diagram, the starting and ending state for the transition,
and three columns titled trigger, action, and comment.
The trigger column describes the combination of events
and conditions that initiates the transition (e.g., message
Sx,Fy received). The trigger should be related to a
single clearly defined event at the equipment. The
action column identifies the activities associated
directly with the transition. These activities may be of
three types: a) actions taken upon exit of the old state,
b) actions taken upon entry to the new state, and c)
actions not associated with either state. These are not
differentiated in this document. The final column
allows for additional comments that help to clarify the
transition. Table A.5, an example of transition table,
illustrates the motor example in Figure A.5.2.
Table A.5 Transition Table for Motor Example
# Current
State
Trigger New
State
Action Comment
1 OFF Switch turned
to on position.
ON Power
supplied to
motor.
Power
supply
assumed
available.
Motor begins
to turn.
2 ON Switch turned
to off position.
OFF Power
supply to
motor dis-
connected.
Motor begins
deceleration.
A.6 Example Control Model Application
This section provides one example of a host’s
interaction with an equipment’s control model. A host
system must have a view of the control model to
understand and predict equipment behavior. However,
the implementor may simplify the host’s view by
assuming that some configuration settings are fixed and
that the host-initiated features are not implemented.
Applying these assumptions simplifies the behavior the
host expects to see.