semi合集-English.pdf - 第4181页
SEMI F70-0302 © SEMI 2002 4 9 Procedu re 9.1 A typical gas delivery system config uratio n is show n in Figure 4. T he follow ing test procedure shall be interpreted to apply to the actual test sy stem and recorded by th…
SEMI F70-0302 © SEMI 2002
3
8 Preparation of Apparatus
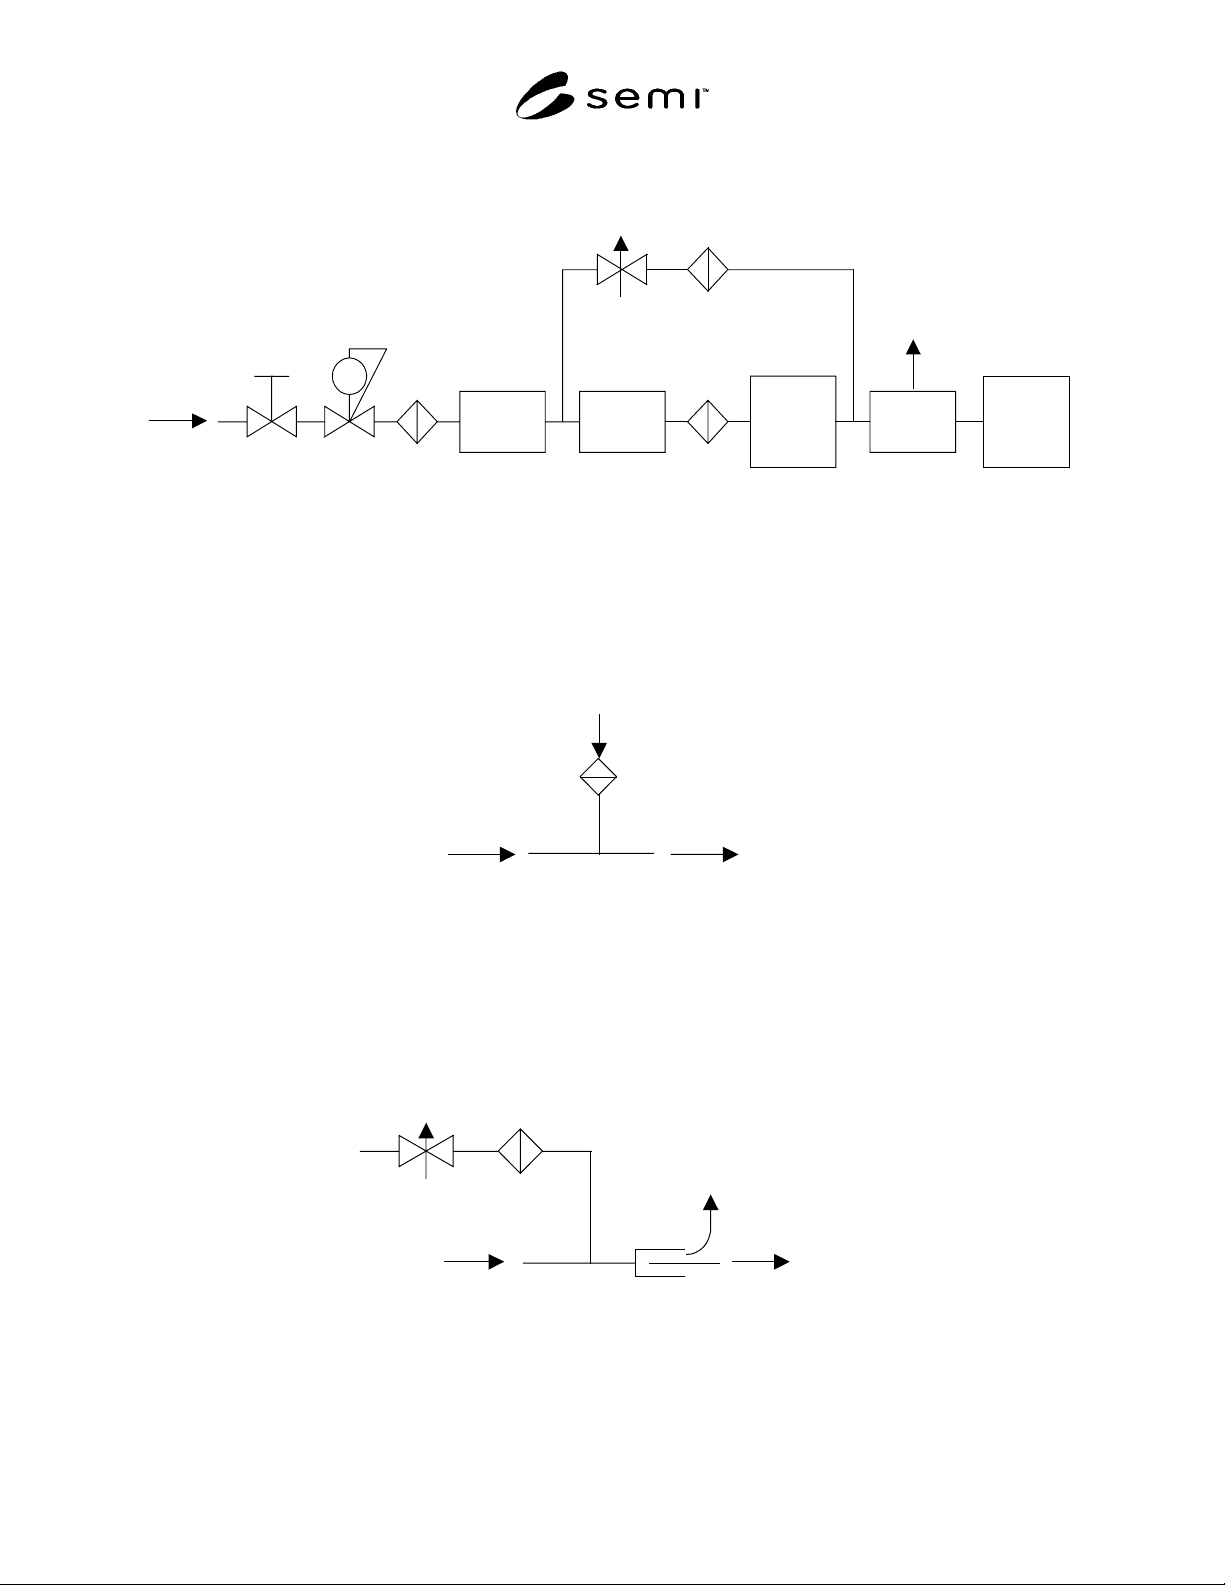
8.1 Set up apparatus and the gas supply system as shown in Figure 1.
NV
RG F
N2
By-pass
MFM
System
Under
Test
Particle
Counter
Sampler
F
F
MFC
VENT
V
Legend, V: Valve MFC: Mass Flow Controller MFM: Mass Flow Meter
F: Filter RG: Regulator NV: Needle Valve
Figure 1
Test Set Up Basic Flow Diagram
8.2 If the test flow rate is equal to or less than the sample flow rate required by the particle counter, insert a filter in
place of the sampler to fulfill the sample flow rate. (See Figure 2.)
Test
Flow
Particle
Counter
Filter
Test Flow Rate
≤
Sample Flow Rate
Figure 2
Full Sampling
8.3 If the test flow rate is higher than the sample flow rate required by the particle counter, use the sampler for
partial sampling. (See Figure 3.) To establish the test flow rate and obtain an isokinetic condition, it is required to
adjust the MFC in the test set up and the NV on the by-pass line. The by-pass line is required to have a capability to
handle the maximum test flow when the valves in the system under test is closed position during the pulse test.
Sampler
Particle
Counter
Test
Flow
Vent
FNV
By-pass
Test Flow Rate
>
Sample Flow Rate
Figure 3
Partial Sampling
SEMI F70-0302 © SEMI 2002
4
9 Procedure
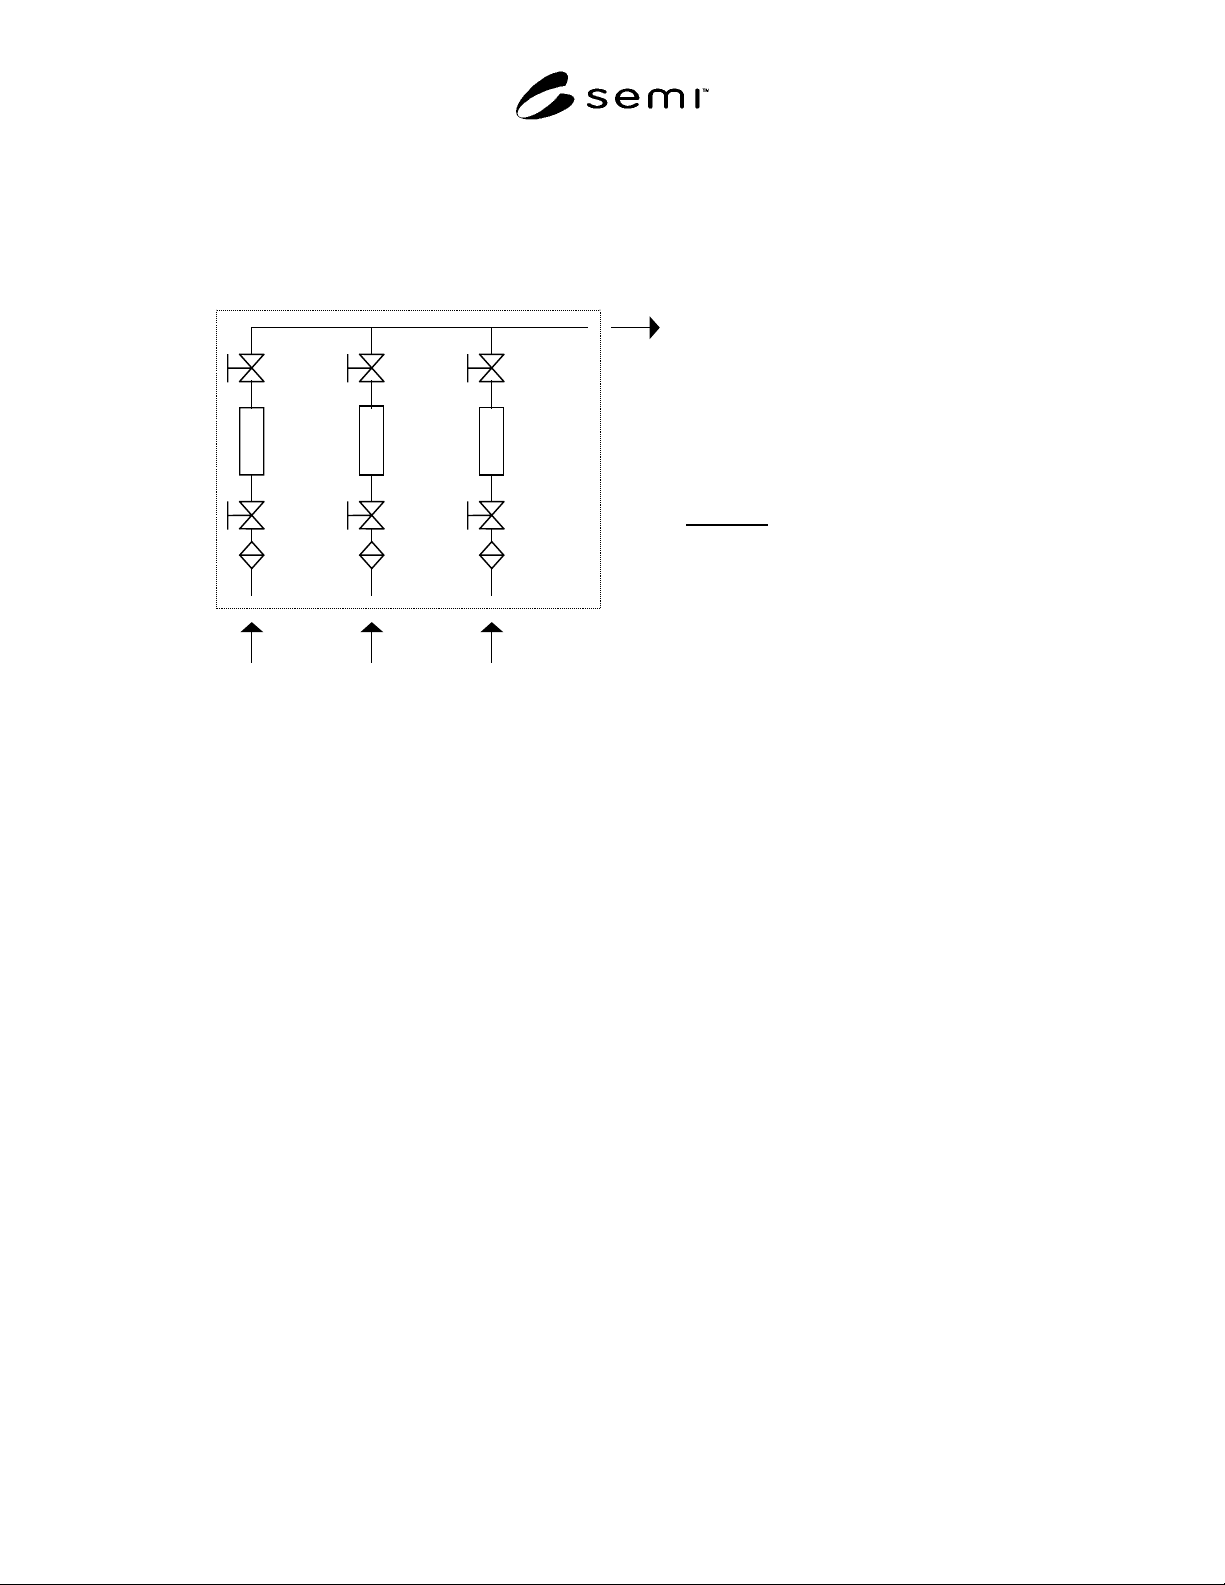
9.1 A typical gas delivery system configuration is shown in Figure 4. The following test procedure shall be
interpreted to apply to the actual test system and recorded by the operator.
V2 V4 V6
V1 V3 V5
F1
F2 F3
MFC1 MFC2 MFC3
LINE1 LINE2 LINE3
LEGEND
V1 - 6 Valves
F1 - 3 Filters
MFC1 -3 Mass Flow
Controllers
System Under Test
Figure 4
Typical Gas Delivery System Configuration
9.2 Determination of Background Counts
9.2.1 For test set up, insert a spool piece in place of the
system under test (i.e. the gas delivery system) as in
Figure 1.
9.2.2 Establish the test flow rate as 1.5 times of the
design flow rate and supply N
2
(or Ar). In this case the
design flow rate is determined as the flow rate of the
line which has maximum flow rate in the system under
test. Purge the test set up for more than 10 minutes.
9.2.3 Confirm the particle count is not more than 1
during 10 minutes after the purge. If the total volume of
the test flow is less than 28.3 liters, extend the sampling
time until it achieves more than 28.3 liters. If the
particle count is more than 1, repeat Sections 9.2.2 and
9.2.3.
9.2.4 Replace the spool piece with the test system.
9.3 Static Flow Test
9.3.1 Close all valves in the line 2 and 3, set the MFCs
as full scale or purge mode if available and fully open
the valves in the line 1.
9.3.2 Supply N
2
(or Ar) to the line 1 with 1.5 times of
the design flow rate of the line 1 and purge the test set
up for more than 10 minutes. In many case, this will
require the activation of the valve override on any
MFCs on the test line. It is also required to verify that
all components in the system can withstand 1.5 times
the design flow rate.
9.3.3 Count particles for more than 10 minutes. If the
total volume of the test flow is less than 28.3 liters,
extend the sampling time until it achieves more than
28.3 liters.
9.3.4 Repeat Sections 9.3.2 and 9.3.3 per all lines.
9.4 Pulse Flow Test
9.4.1 Close all valves in the line 2 and 3, set the MFCs
as full scale or purge mode if available and fully open
the valves in the line 1.
9.4.2 Supply N
2
(or Ar) to the line 1 with 1.5 times of
the design flow rate of the line 1 and purge the test set
up for more than 10 minutes.
9.4.3 Actuate V1 at the rate of 30 cycles/minute for 10
minutes if V1 is pneumatically operated valve. For
manually operated valve, actuate the valve at 4
cycles/minute for 10 minutes. Each cycle consists of on
and off actuation of the valve. The on and off cycles
should be of equal duration. If the total volume of the
test flow is less than 28.3 liters, extend the sampling
time until it achieves more than 28.3 liters. Count
particles during the period.
9.4.4 Repeat Section 9.4.3 for V2.

SEMI F70-0302 © SEMI 2002
5
9.4.5 Repeat Sections 9.4.1 to 9.4.4 per all lines.
NOTE 2: For the pulse test, the total volume of the test flow
shall be half of the test flow rate multiplied by the sampling
time.
10 Calculation and Report
10.1 The following test conditions are to be included in
the test report:
• counter type (LPC or CNC)
• manufacturer of counter
• counter model (manufacturer’s model # or part #)
• sample flow
• particle diameter
• sampler diameter
• sample probe diameter
• test gas
• background count
• valve operation interval (for the pulse flow test)
• flow diagram of the system under test
10.2 Calculation of Data — The test result is reported
in number of particles in liters denoted by floating point
representation with two significant digits (ex. 2.3 × 10
-
2
/L). The method of calculation is shown in Section
10.2.1.
10.2.1 The following formula is used to calculate the
particles in a liter:
PARTICLES
N
V
=
where N: Total particle counts in 10 minutes or in the
extended period if the total volume of the test flow is
less than 28.3 liters.
V: Total sampling volume in liter in 10 minutes (mass
flow meter read value) or in the extended period if the
total volume of the test flow is less than 28.3 liters.
If the sample flow rate is equal to or more than the test
flow rate, V is equal to the total volume of the test flow
in liter in the sampling time.
If the sample flow rate is less than the test flow rate, V
is equal to the total volume of the sample flow in liter in
the sampling time.
10.3 Report Format — Sample report formats are
given in Appendixes 1 and 2.