semi合集-English.pdf - 第5231页
SEMI M40-0200 © SE MI 2000 13 RELATED INFORM A TI ON 1 EXPERIMENTS A N D MODELS RELA TING TO ROUGHNESS DISTRIBUTI ON OF SILICON WAFERS NOTE: This re lated inf o rmation is n o t an of ficial part of SEMI M40 b ut was app…

SEMI M40-0200 © SEMI 2000 12
NOTICE: SEMI makes no warranties or representations as to the suitability of the guide set forth herein for any
particular application. The determination of the suitability of the guide is solely the responsibility of the user. Users
are cautioned to refer to manufacturer’s instructions, product labels, product data sheets, and other relevant literature
respecting any materials mentioned herein. These guides are subject to change without notice.
The user’s attention is called to the possibility that compliance with this guide may require use of copyrighted
material or of an invention covered by patent rights. By publication of this guide, SEMI takes no position respecting
the validity of any patent rights or copyrights asserted in connection with any item mentioned in this guide. Users of
this guide are expressly advised that determination of any such patent rights or copyrights, and the risk of
infringement of such rights, are entirely their own responsibility.

SEMI M40-0200 © SEMI 200013
RELATED INFORMATION 1
EXPERIMENTS AND MODELS RELATING TO ROUGHNESS
DISTRIBUTION OF SILICON WAFERS
NOTE: This related information is not an official part of
SEMI M40 but was approved for publication by full letter
ballot procedures.
R1-1 Executive Summary
R1-1.1 Roughness is measured traditionally only on
selected spots on a surface and only a few methods,
such as light scattering, are practical for a complete
surface scan. Therefore a systematic, standardized
approach is required for defining the roughness of the
entire surface of a silicon wafer. This can be done by
defining one or several patterns of measurement spots
which represent the entire surface so that the deviation
of the average roughness and its standard deviation
from the “true” values are small. The task of finding
such patterns and verifying that they represent the entire
surface was approached in two steps: 1. by
investigating various patterns on various wafer surfaces
experimentally, and 2. by simulating the roughness map
of surfaces and by applying the selected patterns to
them.
R1-1.2 Five different site patterns were used for the
experimental investigation of silicon wafer surfaces
which were final polished, stock removal polished and
acid etched. The patterns consist of one, five, nine, ten
and thirteen points (thirteen being the sum of a five and
nine point pattern), respectively, and the measurements
were performed with 10, 30, 80 and 250 µm filter
lengths. Therefore 20 average roughness values and
corresponding standard deviations were obtained for
every wafer investigated, five for any filter length.
R1-1.3 Haze maps of these surfaces either displayed no
variation, variations with an approximately rotational
symmetry or a gradient across the surface, respectively.
The average roughness of the surfaces measured with
the various site patterns varied over four and a half
orders of magnitude for the set of wafers used and the
filter settings selected. The corresponding standard
deviations were found to be <10% of the average
roughness with the exception of four 200 mm final
polished wafers where standard deviations up to 50-
60% occurred. The 5-, 9- and 10-point site patterns
were compared with respect to the average roughness
and the corresponding standard deviation for every
wafer. The variation (standard deviation) of the
average roughness and the standard deviations as
measured were found to be smaller than or
approximately 10% in any case when normalized to the
total average roughness of the corresponding wafer
(average over all points of all patterns for a wafer).
R1-1.4 Roughness maps were generated for the
simulation according to three different models: maps
with a roughness pattern with rotational symmetry, with
a linear gradient and with mirror symmetry. Two maps
with a pixel size of 1 mm
2
were generated for each
surface to take into account any anisotropy of the
roughness, and center roughness and edge roughness,
respectively, were used as free parameters for both
maps. These parameters were varied between two level
(0.1 and 0.2) for both maps resulting in a 2
5
factorial
design of “experiment” where the symmetry was
considered as 5
th
parameter. The 1-, 5- and 9-point site
patterns were applied to the various maps and the
average roughness and standard deviation of roughness
were calculated as well as the true values using all
points of a map. Strong effects were observed for the
1-point pattern. As expected one point in the wafer
center does in general not represent the average
roughness of the entire surface reasonably well. The 5-
point measurement provides the correct average ± 6%,
the 9-point measurement is ± 2.5%. Similarly, the 5-
point standard deviation is correct ± 1.6% and the 9-
point one is ± 1%. Second order effects were found to
be smaller than the main effects. Therefore it is
concluded that the suggested five and nine point
measurement patterns provide a good estimate of the
roughness of an entire surface and its variations for
reasonably homogeneous Si wafer surfaces.
R1-2 Introduction
R1-2.1 Roughness measurement of surfaces is
performed with a variety of techniques, the most
common ones being mechanical or optical profiling in
real space or light scattering in reciprocal space (1,2,3).
The numerical result of a roughness measurement
process depends significantly on several parameters
such as spatial bandwidth of the response function of
the tool used including filtering, scan length, probe
diameter, scanning speed etc. These parameters are not
independent of each other and have been standardized
only for mechanical profilers (e.g.4,5). The roughness
values reported by different types of tools usually do
not agree but they correlate provided their parameters
were set up not too differently (6). The standardized
roughness metrics such as average roughness R
a
or
root-mean-square roughness R
q
refer mainly to line
scans as performed by profiling techniques (e.g. 7).
Area scans performed by profiling tools by aligning a
series of line scans are usually very slow. Scanning the
entire surface of a Si wafer with a profiler therefore
SEMI M40-0200 © SEMI 2000 14
would consume many hours, in the case of AFM
(Atomic Force Microscope) many years.
R1-2.2 Techniques based on light scattering are
capable of scanning the entire wafer surface quite
rapidly, in about 1-2 min. Their response function,
however, has a limited spatial bandwidth ranging
approximately from 0.5 to 40 µm. Standards for light
scattering measurements are now emerging (8,9).
R1-2.3 The obvious solution for obtaining a
standardized roughness value of an entire surface is a)
to define a pattern of sites where one- or two-
dimensional scans are performed and b) to report the
significant parameters along with the measurement
(roughness) result. The second task can be solved
theoretically by collecting the important parameters and
by designing an appropriate abbreviation code. The
first task requires experiments to collect data about the
variation of roughness across a typical, real wafer
surface and numerical simulations to find a set of sites
the roughness of which agrees sufficiently well with the
roughness of the entire surface.
R1-2.4 This appendix reports the results of
corresponding roughness measurements as well as of a
numerical simulation using a virtual design-of-
experiment (DOX).
R1-3 Roughness Definitions
R1-3.1 A variety of definitions for roughness have
been standardized by national and international
institutions in the US, Japan and Europe.
Corresponding standards are listed in section 5 of the
main document and some selected ones again in
reference 7. Most widely used are average roughness
R
a
and root-mean-square roughness R
q
. Both refer to
the average deviation of a profile from a reference line.
R1-4 Roughness Measurements
R1-4.1 Experimental Details
R1-4.1.1 Four groups of four wafers each were
investigated to collect data about the variation of
roughness across the wafer surface. The wafers were
selected to represent different process steps and
polishing techniques:
a)
final polished wafers, 150 mm, #1-4
b) final polished wafers, 200 mm, #4-8
c) pre-polished wafers, 200 mm, #9-12
d) acid-etched wafers, 200 mm, #13-16.
R1-4.1.2 The wafers were characterized for haze with
an SSIS (Censor ANS-100) and the roughness
measurements were performed with an optical non-
contact profiler (Chapman MP-2000+). The roughness
data were taken by performing scans of length 3 mm
and were evaluated using filters of 19, 30, 80 and 250
µm, respectively. The scans were performed at a
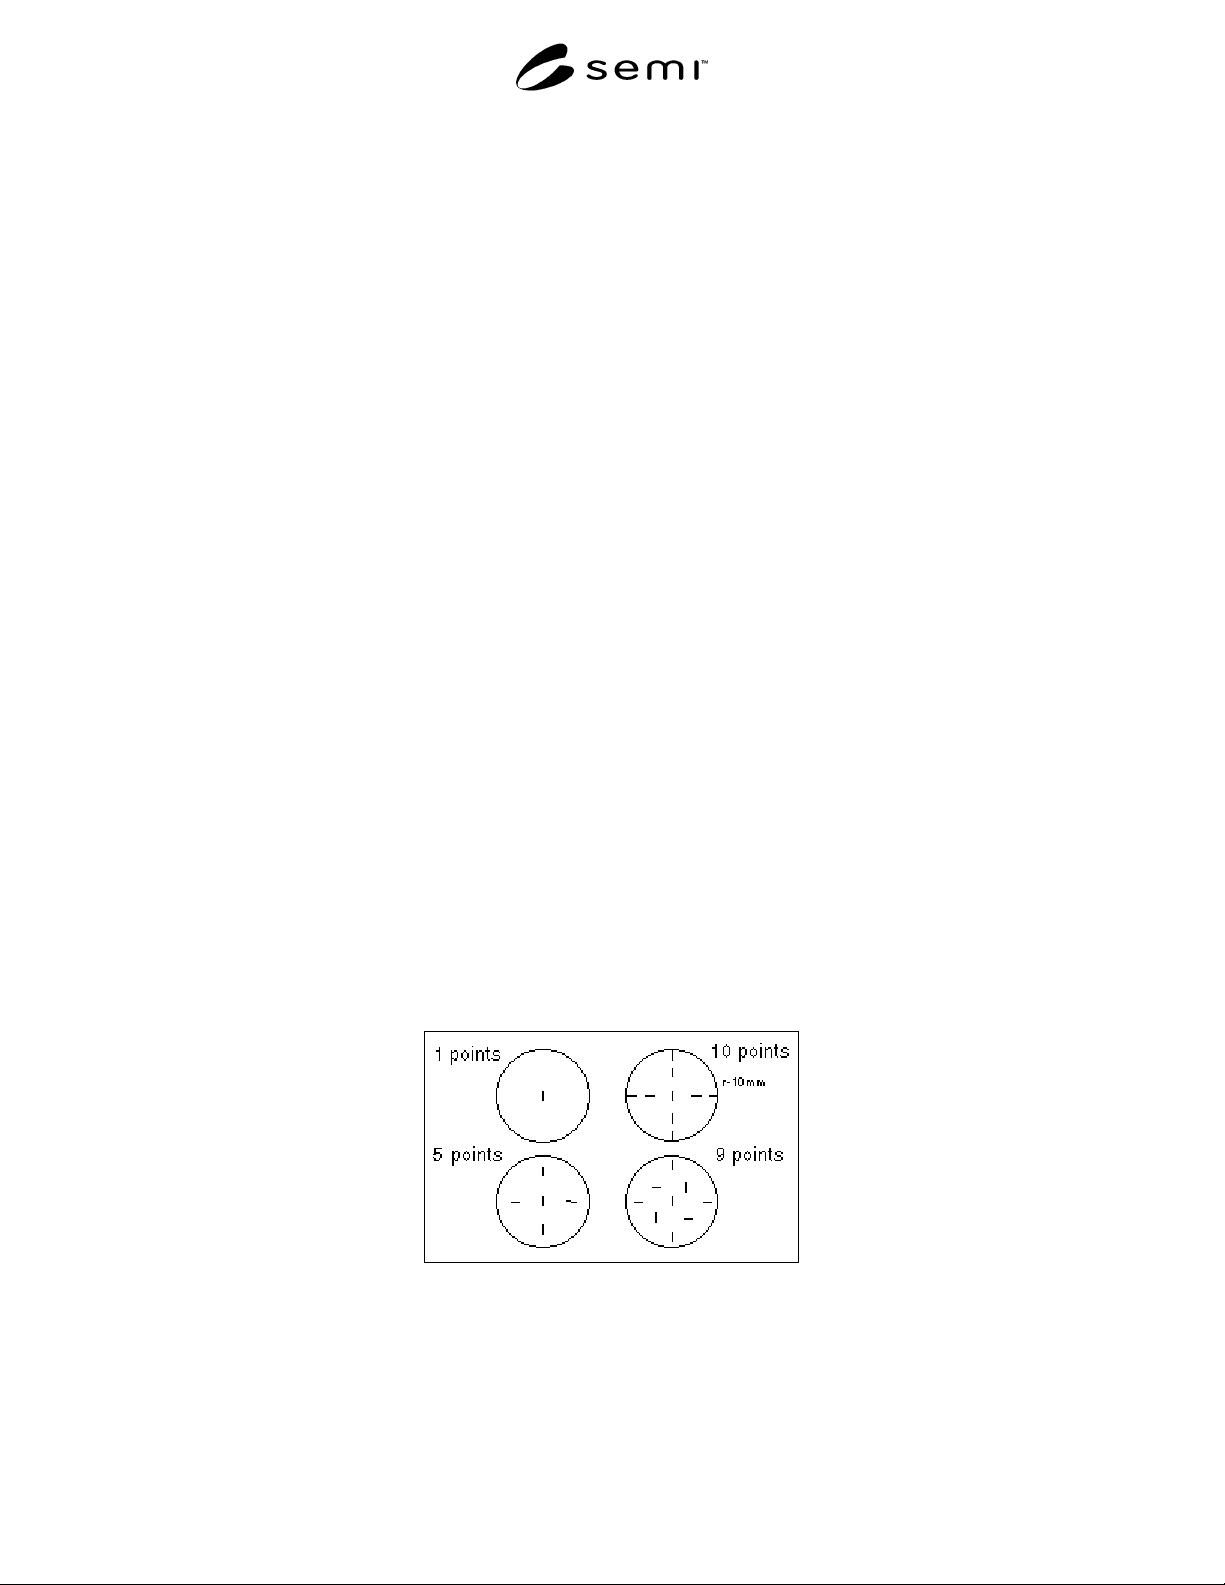
variety of sites according to four different site patterns
as displayed in Figure R1-1 where also the directions of
the various scans are indicated:
i) center of wafer, one scan
ii) five points, center of wafer plus four points at 2/3
of radius
iii) nine points, center of wafer plus four points at 2/5
of radius plus four points at 4/5 of radius
iv) ten points, two in the center of wafer plus four
points at ½ of radius and four points at radius
minus 10 mm.
v) thirteen points, combination of pattern ii and iii.
Figure R1-1
Site Patterns