semi合集-English.pdf - 第538页
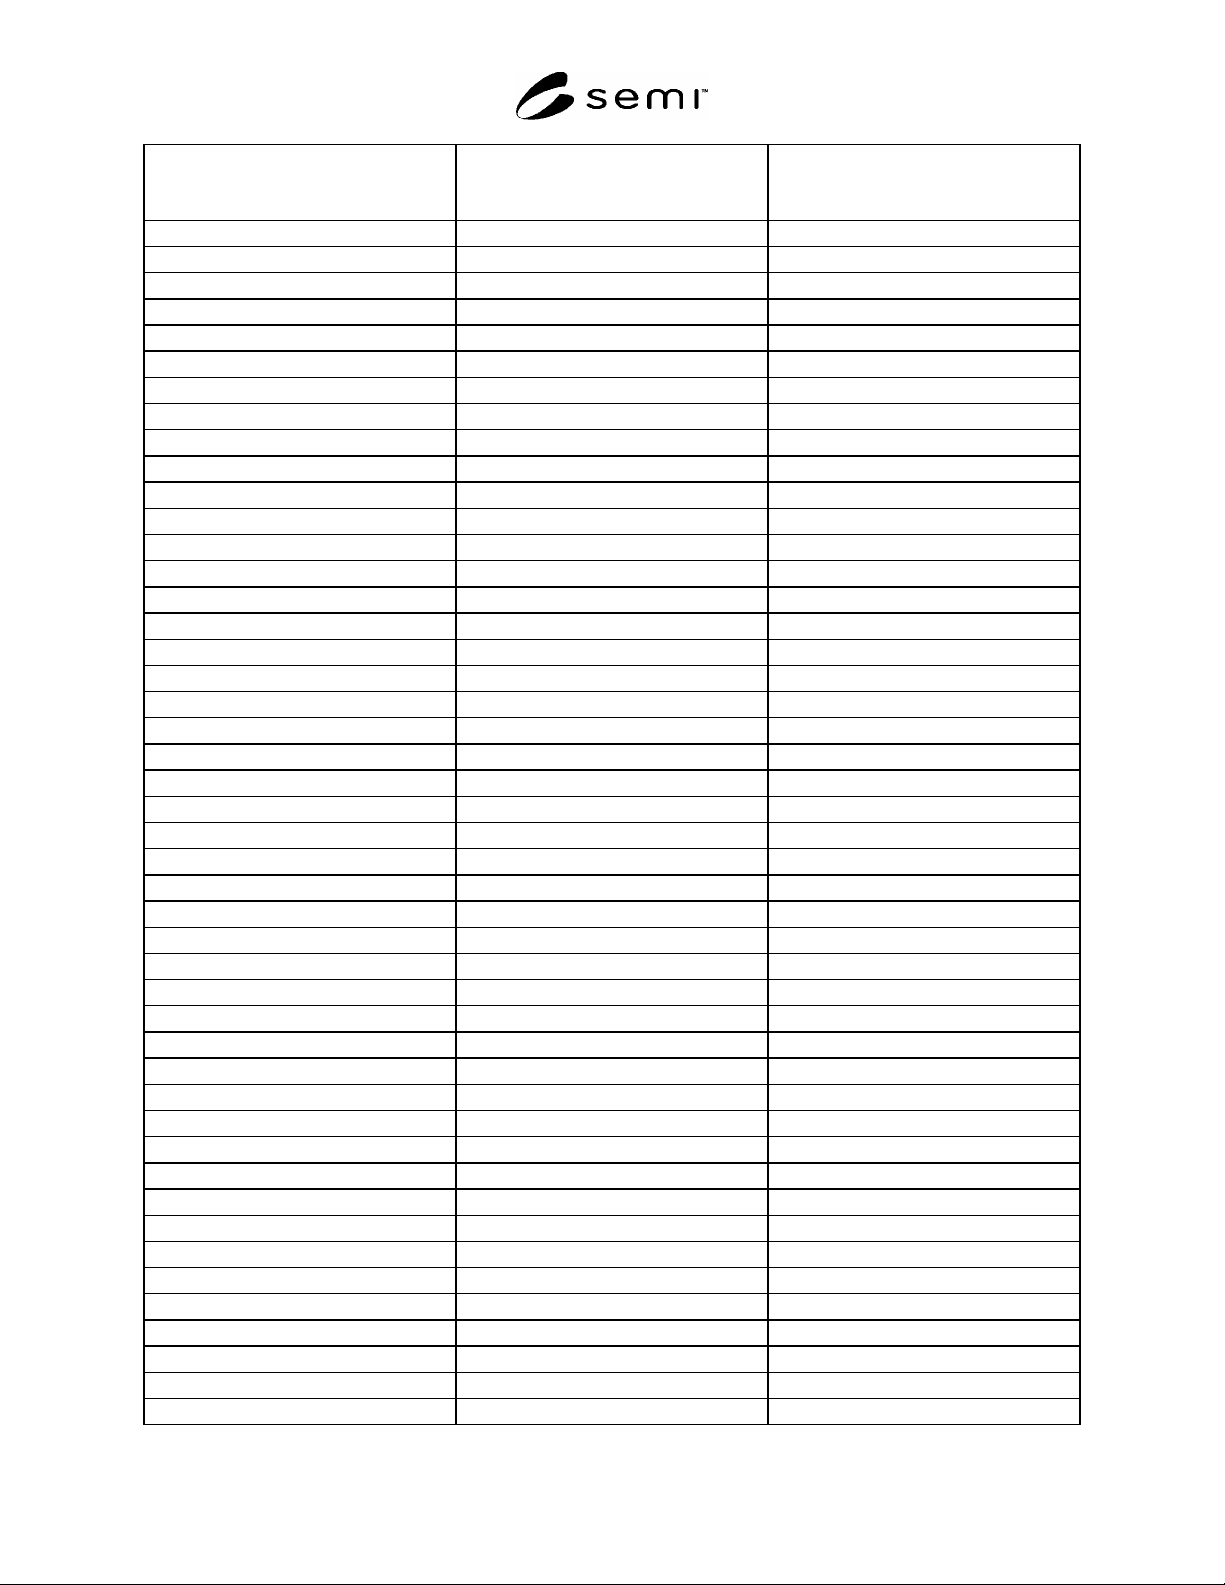
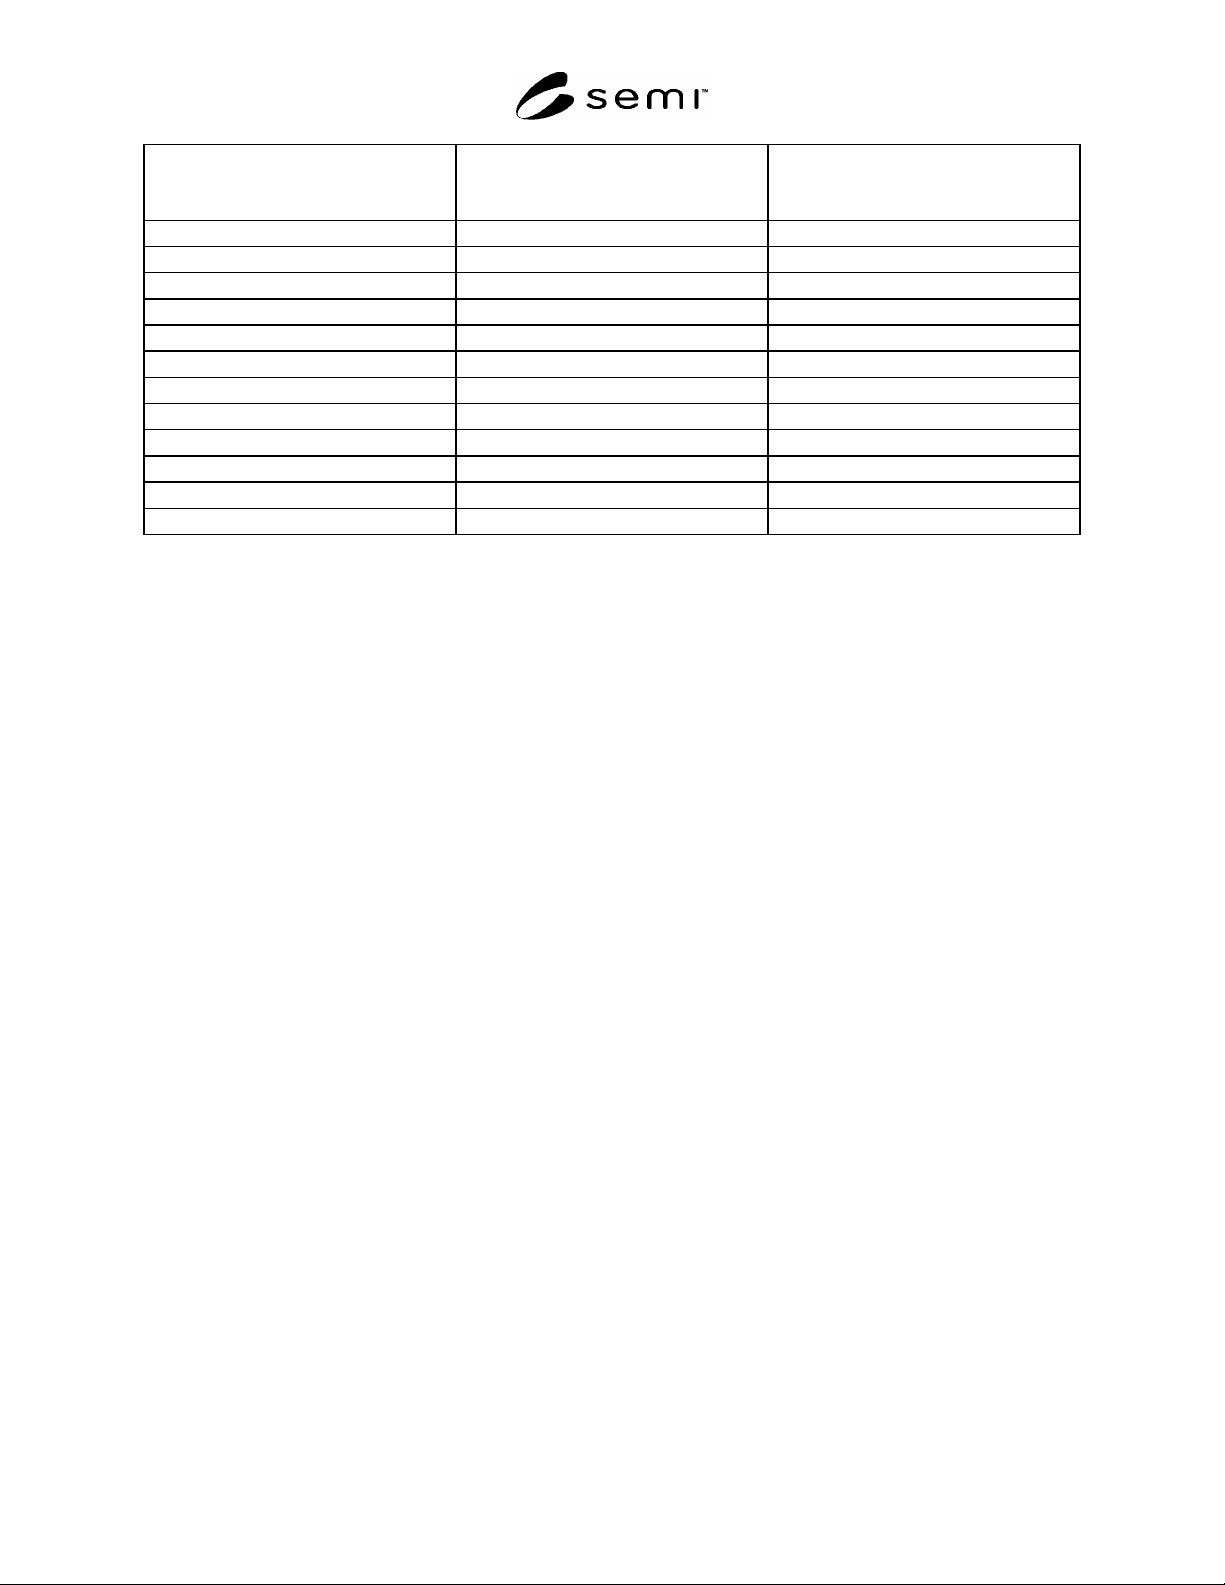
SEMI E77-1104 © SEMI 1998, 2004 6 Column A D.U.T. Setpoint Indication in % F.S. Column B D.U.T. Flow Indication in % F.S. Column C Flow Standard Raw Data 70 60 50 40 30 10 0% __________________ 0 10 20 30 40 0% _________…
SEMI E77-1104 © SEMI 1998, 2004 5
Column A
D.U.T. Setpoint
Indication in % F.S.
Column B
D.U.T. Flow
Indication in % F.S.
Column C
Flow Standard
Raw Data
50
60
70
80
90
100
90
80
70
60
50
40
30
10
0% __________________ 0
10
20
30
40
50
60
70
80
90
100
90
80
70
60
50
40
30
10
0% __________________ 0
10
20
30
40 0
50
60
70
80
90
100
90
80
SEMI E77-1104 © SEMI 1998, 2004 6
Column A
D.U.T. Setpoint
Indication in % F.S.
Column B
D.U.T. Flow
Indication in % F.S.
Column C
Flow Standard
Raw Data
70
60
50
40
30
10
0% __________________ 0
10
20
30
40
0% __________________
#1
0%; the MFC is not controlling gas flow in this state but rather is in a no-flow condition during which MFC zero offset is to be recorded.
12.10 Set the D.U.T. output to zero per the
manufacturer’s procedure. This may entail automatic
re-zeroing of the device, or may require an adjustment
by the operator.
12.11 Record the adjusted zero reading in Table 1.
12.12 The reference supply conditions used shall be
the reference values specified by the manufacturer. For
those instances when a range of values is specified
rather than a reference value, the midpoint of the range
shall be taken to be the reference value.
12.13 The power supply must be sufficiently rated for
the device under test. In addition, the following supply
conditions and tolerances shall apply reference voltage:
12.13.1 AC Supply — ± 1%
12.13.2 DC Supply — ± 0.1%
12.13.3 Reference Frequency — ± 0.1 Hz
12.13.4 Harmonic Distortion of AC Supply — 1%
12.13.5 Ripple of DC Supply — 0.1% rms
13 Procedure
13.1 For the gas of interest, collect flow data for five
cycles of 11 different setpoints. The setpoints are
100%, 90%, 80%, 70%, 60%, 50%, 40%, 30%, 20%,
10%, and 0% of full scale. Begin collecting data at the
50% level then 60%, 70% and so on. Record the data
on the form in Table 1.
13.1.1 When a non-zero setpoint is given, allow the
MFC to stabilize at the desired setpoint by observing
the reading on the flow standard. Record the data once
the MFC has stabilized at the current setpoint.
NOTE 2: If, during data acquisition at a nominal setpoint, the
instrument fails to stabilize, the D.U.T. is not stable enough
for the test to proceed.
13.1.2 When a zero setpoint is given, perform the
procedure described in Sections 12.7–12.9 (do not
rezero the MFC) to ensure a “no-flow” condition
through the MFC and record the zero offset indicated
by the MFC’s output in Table 1.
13.2 Use Table 1 to record the following:
13.2.1 Column A — D.U.T. setpoint (% F.S.)
13.2.2 Column B — D.U.T. flow indication (% F.S.)
13.2.3 Column C — Raw flow standard reading (sccm)
14 Calculations or Interpretation of Results
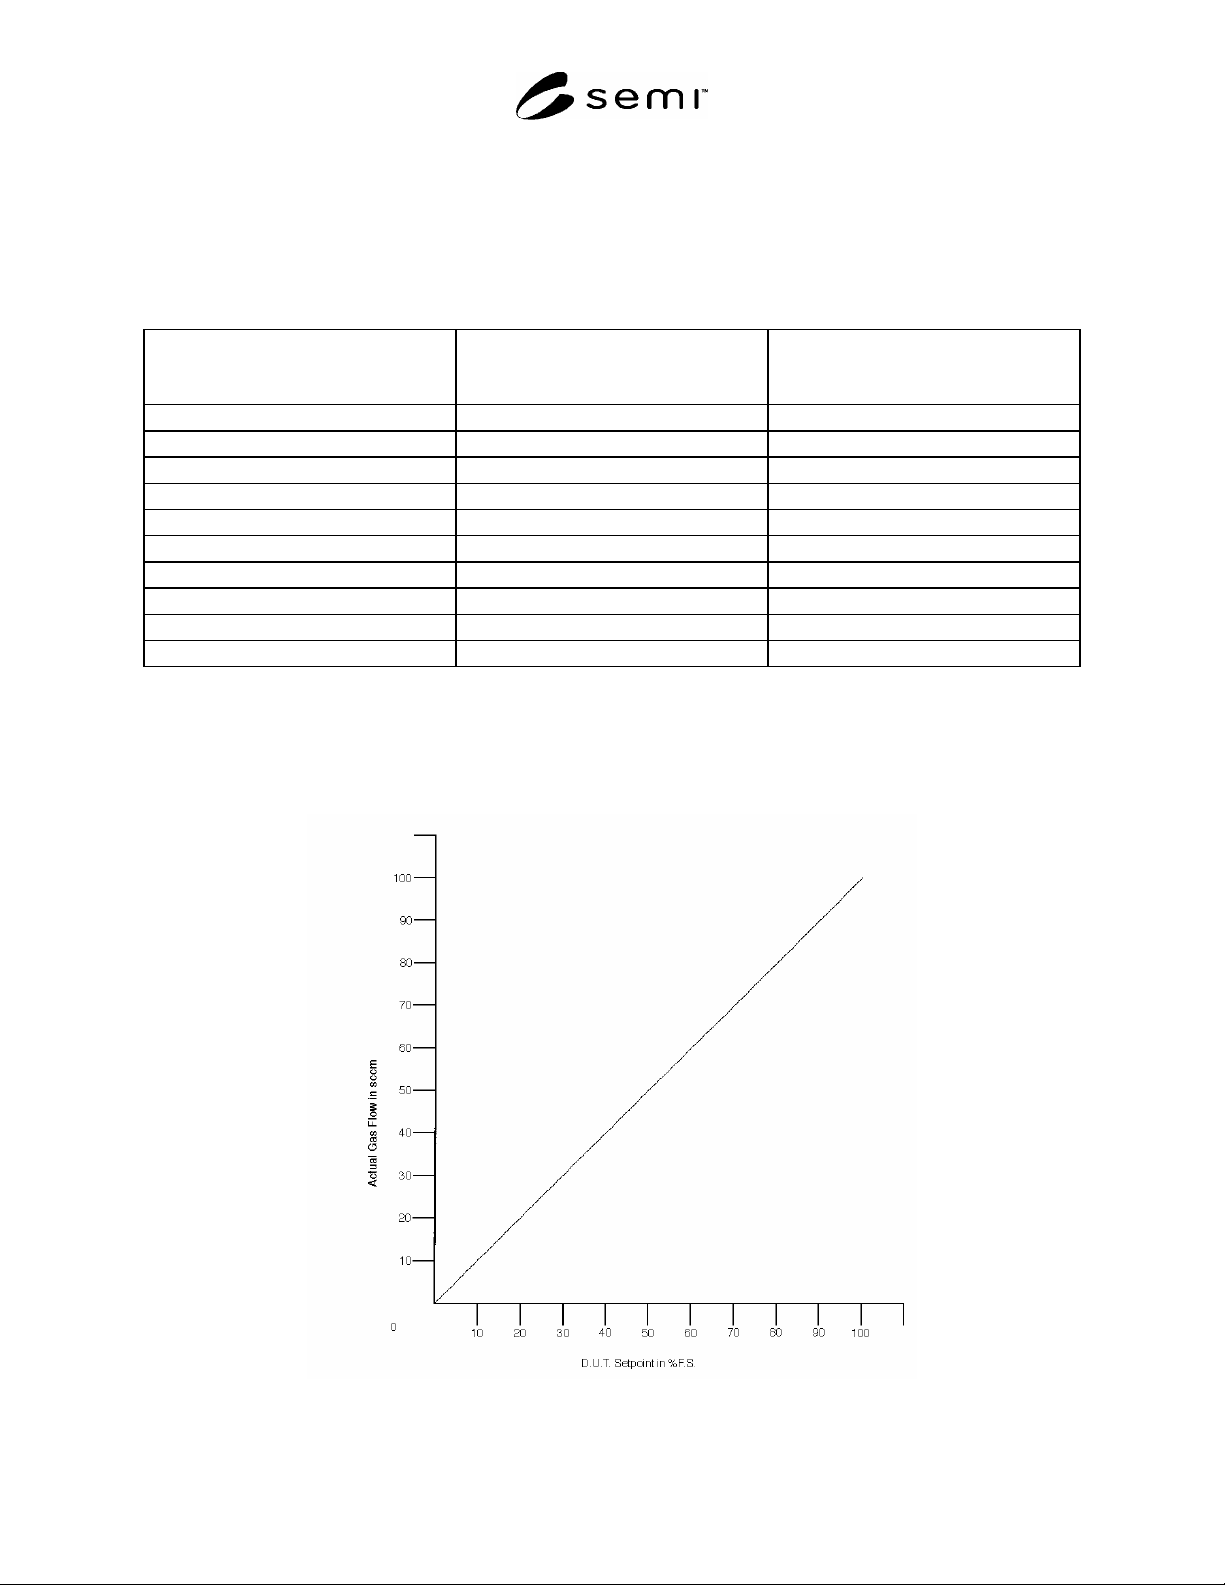
14.1 For each test gas, calculate the mean and standard
deviation of the corrected flow readings, for common
setpoints on the same gas. For example, calculate the
mean and standard deviation for all the 0% readings for
a given gas, then repeat the calculations for the 10%
readings, etc. Record the results on Table 2 in Columns
B and C. Plot the result as illustrated in Figure 2.
SEMI E77-1104 © SEMI 1998, 2004 7
Table 2 Statistical Performance
MFC Mfg/Model/Serial # ____________________________________
Name Plate Gas/Range ____________________________________
Test Gas ____________________________________
Temp ___________ Bar ___________ Date ___________
Factory Calibration Gas ____________________________________
Column A
D.U.T. Setpoint
(% F.S.)
Column B
Mean Corrected Standard
Flow Reading (SCCM)
Column C
Standard Deviation
Flow (SCCM)
10
20
30
40
50
60
70
80
90
100
Nameplate Gas/Range ___________ Test Gas ________________ Date _____________
MFG/Serial # _________________ Barometric Pressure _______________
Inlet Pressure _________________ Temperature _____________________
Figure 2
D.U.T. Setpoint vs. Gas Flow