semi合集-English.pdf - 第6583页
SEMI C1-0705 © SEMI 1978, 2005 9 90% Upper Confidence Limit n s t p df 10 . 0 , UCL % 90 where n is the to tal number of assay m easurements taken on the sample in question and t is a t-statistic with the as sociated d…
SEMI C1-0705 © SEMI 1978, 2005 8
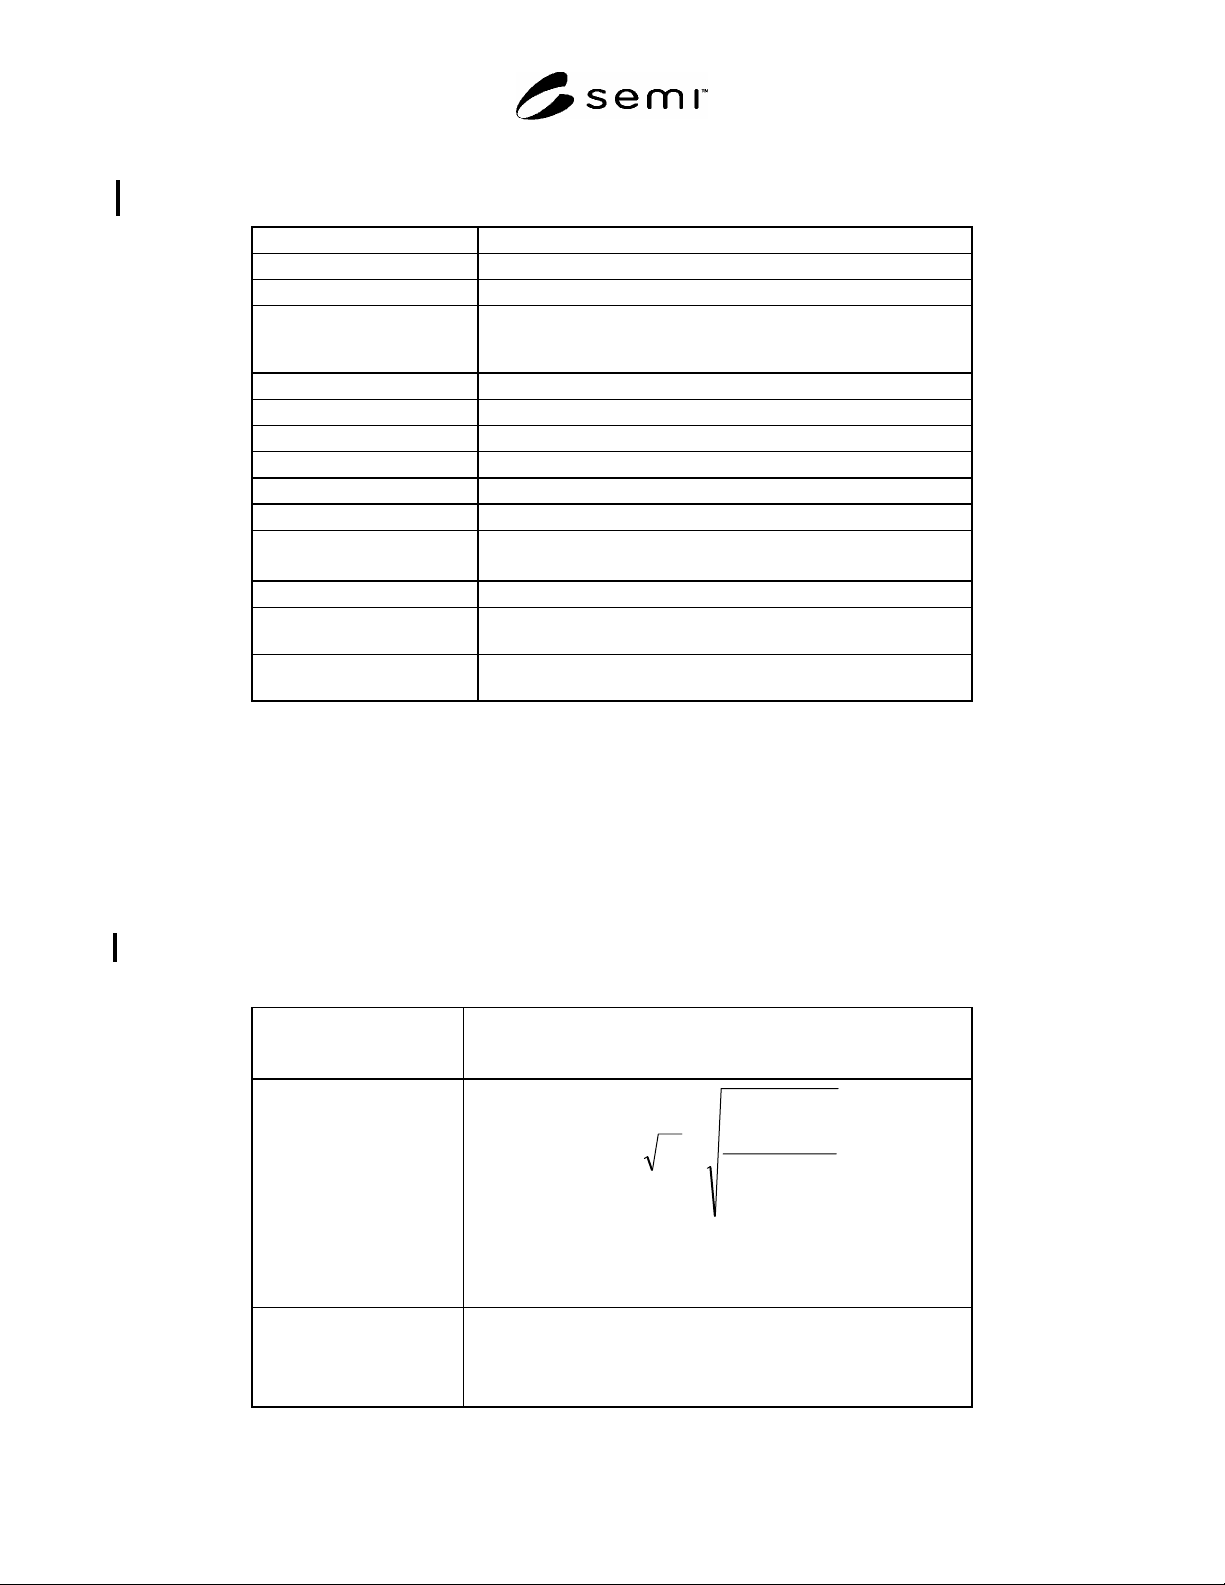
Table 2 Data Reporting Requirements for Trace Metals, Trace Anions, and
Moisture
Sample A Result A
Sample B Result B
Average Average of Result A and B
Spike The amount of spike equivalent to 50% of the specified value for
trace impurity, and it should be added to the sample prior to any
sample preparation (ex., sample dilution, evaporation, etc.)
Spike Sample C Result C
Spike Sample D Result D
Recovery 1 Result C – Average
% Recovery 1 (Recovery 1 / Spike) × (100)
Recovery 2 Result D – Average
% Recovery 2 (Recovery 2 / Spike) × (100)
Average % Recovery (% Recovery 1 + % Recovery 2) / 2
% Recovery Range Max. % Recovery - Min. % Recovery
Result Standard Deviation When applicable, report the Std. Dev. of multiple measurements
for each Result
Relative Standard Deviation When applicable, report the Relative Std. Dev. of multiple
measurements for each Result
6.1.2.3 Measurement Repeatability targets how well measurements can be repeated and should be reported as
percent (%) relative standard deviation (Tables 2 and 4).
6.1.3 Interference Checks
6.1.3.1 List all interferences that were examined during the course of method validation. Also note any known
potential interferences.
6.1.4 Data Reporting Requirements
6.1.4.1 Table 2 along with Figure 1 illustrates the minimal data structure and analysis required to support method
validation for trace metals, trace anions, and moisture. Table 3 is used for assays.
Table 3 Data Reporting Requirements for Assays
Specification Width W = upper spec. limit – lower spec. limit
If no upper spec. limit is stated for an assay of an ultrapure product,
use 100%.
Pooled Standard Deviation
N
i
i
N
i
ii
pp
n
sn
ss
1
1
2
2
1
1
where N1 groups of current or historical n
i
2 assays taken on the i
th
sample have their standard deviations pooled and
2
i
s is the standard
deviation of the data in the i
th
group squared.
Degrees of Freedom
N
i
i
ndf
1
1
where degrees of freedom 4

SEMI C1-0705 © SEMI 1978, 2005 9
90% Upper Confidence
Limit
n
s
t
p
df 10.0,
UCL%90
where n is the total number of assay measurements taken on the
sample in question and t is a t-statistic with the associated degrees of
freedom and 10% of the distribution to its right
6.1.4.2 In cases for trace metals, trace anions, and moisture where more samples are measured, statistical quantities
analogous to those in Table 2 should be constructed. For methods where automatic consecutive measurements can
be obtained from the instrument, Results A, B, C, and D should be the mean of five or more instrumental
measurements.
6.1.5 Summary of Criteria for Success — The success of the criteria for each figure of merit depends on the
specification, the matrix of the analyte, and levels of detection required. For trace metals, trace anions and moisture,
method success criteria are found in Table 4. For assays the 90% upper confidence limit can not exceed 30% of the
specification’s width.
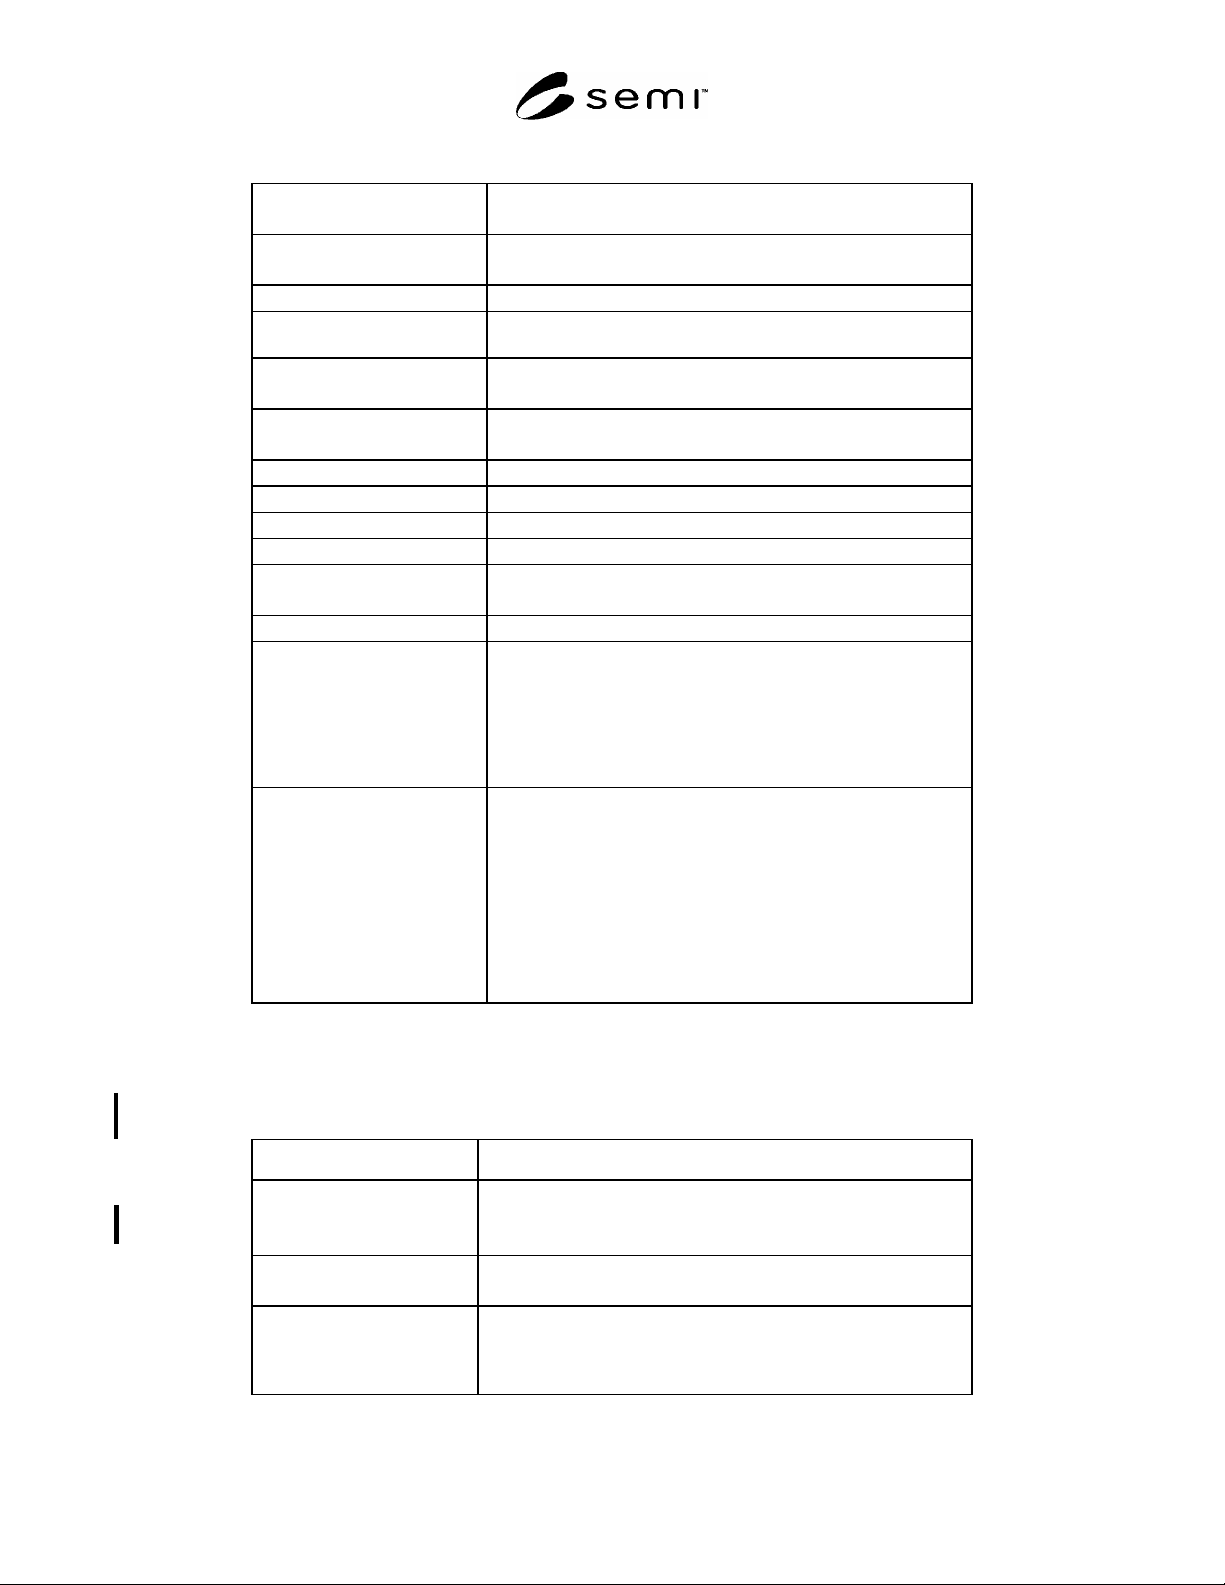
Table 4 Method Success Criteria for Trace Metals, Trace Anions and Moisture
Figure of Merit Criteria for Successful Method
Accuracy
Spiked Recovery Study
75-125% Spiked Recovery for each spiked sample.
Method Precision
Spiked Recovery Study
% Recovery Range less than or equal to 35%.
Measurement Precision Maximum RSD = 20% of the concentration of each spiked
sample where:
100x
Sample Spiked of Conc.
ResultStd.Dev.
RSD
Method Detection Limit As per SEMI C10: Guide for Determination of Method
Detection Limits; Method Detection Limits cannot exceed the
specification.
Interference Checks
If interferences were examined or potential interferences
exist, list them.
6.1.6 Applicability to Existing Specifications — The current implementation of Method Validation only applies to
new or revised specifications. Any prior method validated by SEMI to support a given specification still remains
applicable to that specification.
6.1.7 Example: Trace Metals, Trace Anions and Moisture — Suppose that repeat measurements from four samples;
A, B, C and D were available as follows:
Sample A: 0.19, 0.21, 0.25, 0.15, 0.23
Sample B: 0.31, 0.21, 0.17, 0.22, 0.26
Spiked Sample C: 0.83, 0.62, 0.76, 0.79, 0.80
Spiked Sample D: 0.77, 0.87, 0.69, 0.83, 0.84
NOTE 2: Table 5 illustrates the calculations required as per Table 2.
SEMI C1-0705 © SEMI 1978, 2005 10
Table 5 Data Reporting – Example 6.1.7
Sample A (0.19 + 0.21 + 0.25 + 0.15 + 0.23) / 5
= 0.206
Sample B (0.31 + 0.21 + 0.17 + 0.22 + 0.26) / 5
= 0.234
Average (0.206 + 0.234) / 2 = 0.220
Spike The spike level is to be ½ the relevant specification. If the
specification is 1 ppb, then the spike would be 0.5 ppb.
Spike Sample C (0.83+0.62+0.76+0.79+0.80) / 5
= 0.760
Spike Sample D (0.77+0.87+0.69+0.83+0.84) / 5
= 0.800
Recovery 1 (0.760 – 0.220) = 0.540
% Recovery 1 (0.540 / 0.5) = 108
Recovery 2 (0.800 – 0.220) = 0.580
% Recovery 2 (0.580 / 0.5) = 116
Average % Recovery (108 + 116) / 2 = 112
% Recovery Range (116 – 108) = 8
Result Standard Deviation Since repeat measurements were available in this example, report
the sample standard deviations.
Sample A: 0.038
Sample B: 0.053
Sample C: 0.082
Sample D: 0.071
Relative Standard Deviation
(as a %)
Since repeat measurements were available in this example, report
the relative sample standard deviations.
Samp. A: 100 × (0.038 / 0.220) = 17.5
Samp. B: 100 × (0.053 / 0.220) = 24.2
Samp. C: 100 × (0.082 / 0.720) = 11.4
Samp. D: 100 × (0.071 / 0.720) = 9.9
Note use of the average of 0.220 and the sum of the average +
spike (0.720) above.
NOTE 3: This example provided the data for the first three success criteria found in Table 4 as well as providing other required
summary statistics. Table 6 summarizes performance relative to the success criteria.
Table 6 Method Success Criteria for Trace Metals, Trace Anions, and Moisture –
Example 6.1.7
Figure of Merit Criteria for Successful Method
Accuracy
Recovery 1 (108%) as well as Recovery 2 (116%) are in the
required 75–125% Spiked Recovery range.
Method Precision
The % Recovery Range was 8% and meets the requirement of not
exceeding 35%.
Measurement Precision The maximum RSD for the spiked recoveries is 11.4% which is
less than the maximum allowable 20%. Note that the RSDs
calculated for Samples A and B are not relevant for this
requirement.