semi合集-English.pdf - 第6605页
SEMI C10-0305 © SEMI 1998, 2005 2 5.5 Where applicable, this guide supersedes th e earlier related SEMI Guide: SEMI C16. 5.6 The frequency of the MDL determination should be part of the quality assu rance program for the…

SEMI C10-0305 © SEMI 1998, 2005 1
SEMI C10-0305
GUIDE FOR DETERMINATION OF METHOD DETECTION LIMITS
This guide was technically approved by the Global Liquid Chemicals Committee and is the direct
responsibility of the North American Liquid Chemicals Committee. Current edition approved by the North
American Regional Standards Committee on November 4, 2004. Initially available at www.semi.org January
2005; to be published March 2005. Originally published in 1998; previously published February 1999.
1 Purpose
1.1 To provide a minimal set of guidelines for the quantitative determination of a method detection limit (MDL)
from data supporting a SEMI Process Chemicals or Gases specification.
2 Scope
2.1 This guide applies to trace contaminants specified in SEMI Process Chemicals or Gases standards and
guidelines. All relevant trace contaminants should have an MDL determined from a regression analysis of a
calibration curve that is equal to, or less than, their specifications. This guide is intended for use in both establishing
new specifications within SEMI as well as verification of performance to SEMI specifications.
NOTICE: This standard does not purport to address safety issues, if any, associated with its use. It is the
responsibility of the users of this standard to establish appropriate safety and health practices and determine the
applicability of regulatory or other limitations prior to use.
3 Referenced Standards
3.1 SEMI Standard
SEMI C16 — Guide for Precision Reporting/Data Traceability
3.2 Other Document
1
Applied Regression Analysis, 3rd Edition, Norman R. Draper and Harry Smith, John Wiley and Sons, © 1998
NOTICE: Unless otherwise indicated, all documents cited shall be the latest published versions.
4 Terminology
None.
5 Boundary Conditions
NOTE 1: A series of boundary conditions is required of the data from which the MDL is to be determined from.
5.1 Data should be collected on at least two standards at different concentration levels, not including the blank.
5.2 The concentration levels investigated must either span the relevant specification or include it as a level. For this
purpose, the calibration range can be adjusted for instrument sensitivity by pre-concentration or dilution, if
applicable.
5.3 A minimum of three independent sample determinations should be taken on each concentration level of the
standard investigated.
5.4 Matrix Effects
5.4.1 The blank and the standards should be matrix-matched with the sample when testing a specification and run
under the same conditions, both during calibration and sample analysis.
5.4.2 If external standards in a different matrix are used for calibration, the user must compensate for matrix effects
using suitable internal standards.
1 John Wiley & Sons, Inc., 605 Third Avenue New York, NY 10158-0012, 212.850.6000

SEMI C10-0305 © SEMI 1998, 2005 2
5.5 Where applicable, this guide supersedes the earlier related SEMI Guide: SEMI C16.
5.6 The frequency of the MDL determination should be part of the quality assurance program for the laboratory.
6 Procedure
NOTE 2: The determination of the MDL should be performed under the same conditions that samples will normally be run. All
appropriate precautions to avoid contamination should be followed.
6.1 Reagents and Standards — Reagents and standards used should be of the same high-purity as used in the
analysis of samples. Accurate standard solutions of trace contaminants are needed for the preparation of the
calibration standards. Commercially available standard solutions are suitable. These solutions should be traceable to
NIST standards. Working standard solutions should be prepared on the day of use by dilution of the stock standard
solution. Standards and blanks should be matrix-matched to the sample to be analyzed.
6.2 Operating Conditions
6.2.1 Instrumental — Principles of instrumental analysis are provided within many monographs. No general
operating conditions are given here since these will vary with the instrument type and design; consequently, the
manufacturers manual should be followed.
6.2.2 Standard and Sample Preparation — With certain methods, the achievable MDL can be improved by pre-
concentration. Some methods require matrix dilution to run some analyses and may also affect the MDL.
6.2.3 Calibration — Calibrate the instrument for all specified trace contaminants using measurement and
preparation protocols identical to those used in sample preparation and measurement, wherever appropriate. The
calibration data structure used to determine the MDL should be as close to identical as possible to the data structure
normally used for calibration in the laboratory. Minimum data requirements should be determinations at, at least,
two concentration levels (standards), each independently sampled 3 times. The lowest concentration standard should
be at, or below, the specification and give a measurable signal. The blank may be used in the calculation of the MDL
if its variability is judged to be representative of that of a very low-level standard. All instrument response data used
in the analysis should be measurable. The calibration range can be adjusted for instrument sensitivity by pre-
concentration or dilution to match with how the samples are analyzed. Use the data collected to calculate the MDL
using the formulas in the next section.
6.3 Quantification of the MDL
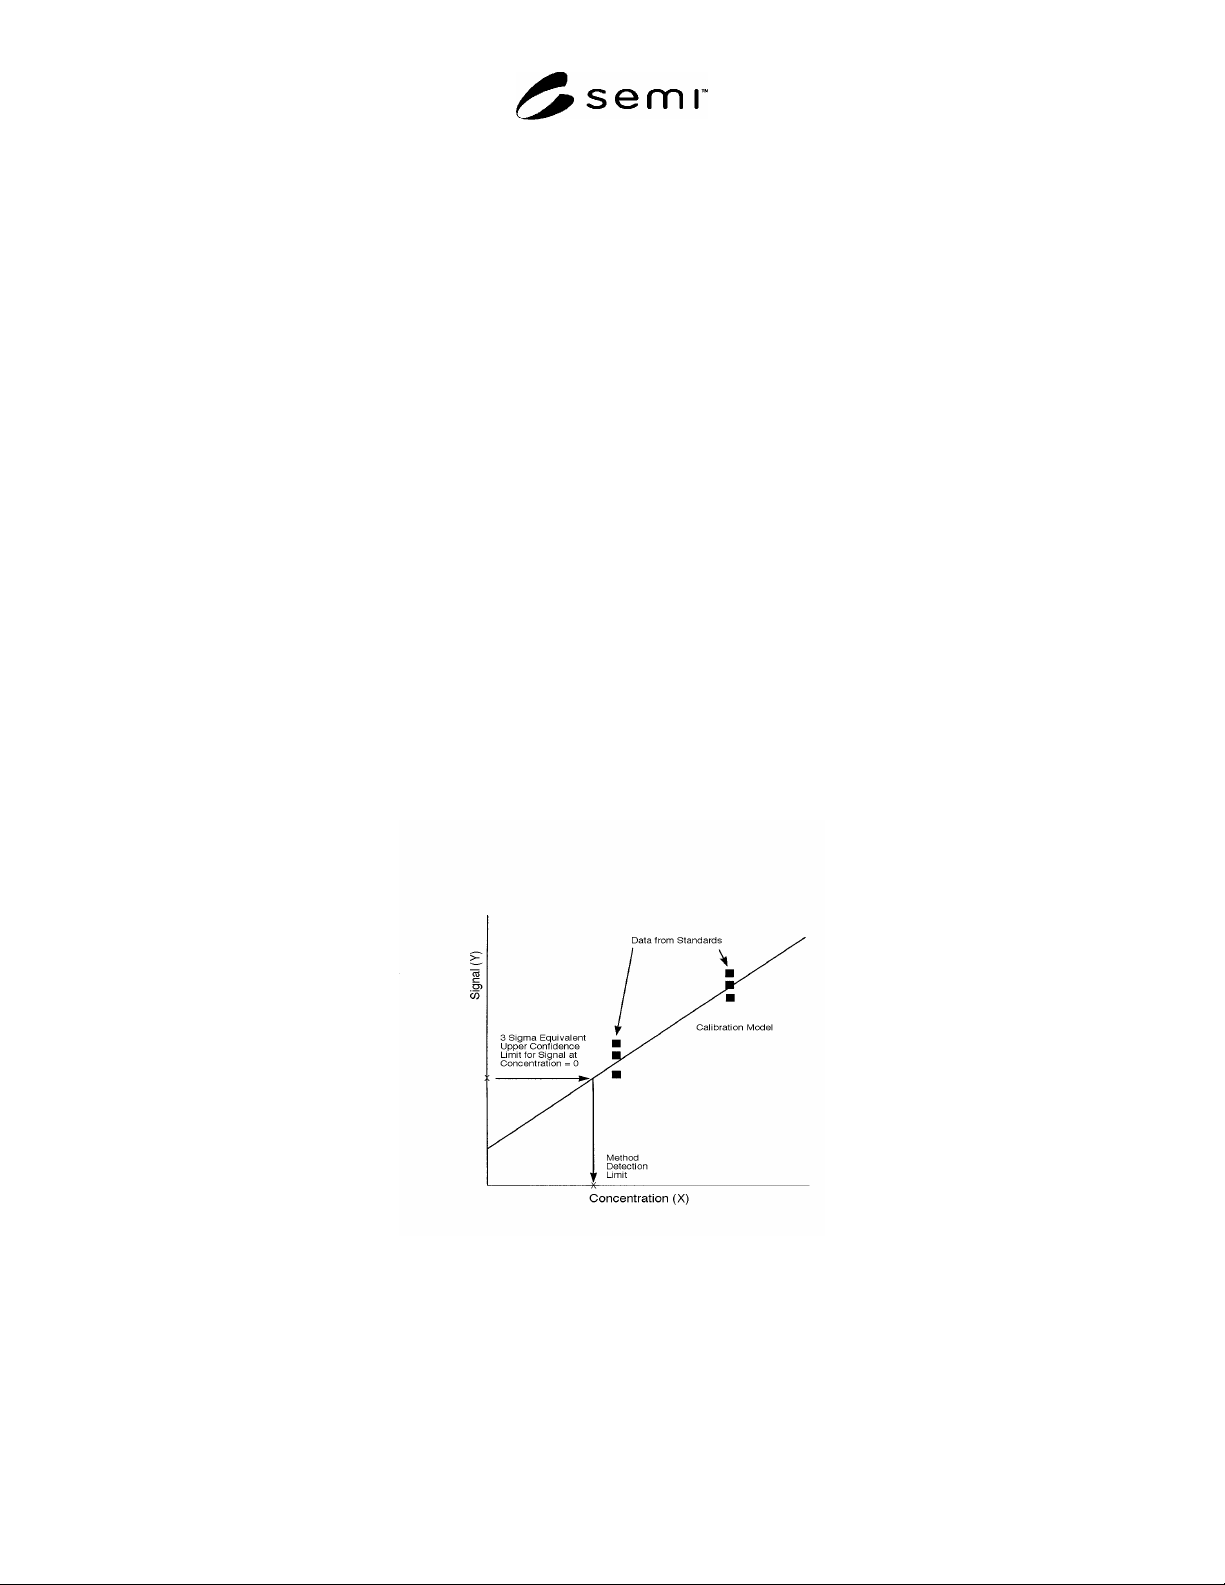
6.3.1 The MDL is calculated by using the results from a regression analysis of the calibration data to obtain a 3
sigma equivalent (in probability) upper confidence limit of individual measurements. Two alternative computational
methods are provided for linear calibration models. One provides the MDL based on an ordinary least squares
(OLS) regression analysis; the other on a weighted least squares (WLS) based regression analysis. These two
computational alternatives do not provide the same MDL. The OLS algorithm is appropriate when signal
uncertainty remains relatively constant over the window of calibration; otherwise, the WLS algorithm is more
appropriate. A third alternative allows the use of similar regression-based approaches for MDL determination in the
presence of a more complex calibration model (e.g., nonlinear, multivariate), or when distributional assumptions of
the other alternatives are not appropriate. Many software packages perform regression analysis, and their use is
recommended.
6.3.2 Statistical Definitions
6.3.2.1 Method detection limit (MDL) — The level at which the errors in the measurement method become large
enough such that the preset maximum acceptable risk of seeing the quantified level, when none of the contaminant
in question is present in the sample, is exceeded.
6.3.2.2 risk — This guide uses 0.13% as the maximum acceptable risk. This is the probability of observing a given
result from a normal distribution that is 3 or more standard deviations above the average. Risk is set on a per-
contaminant basis.
6.3.2.3
calibration curve — An estimate of the relationship between concentration and instrument response (signal
intensity). A line, which has not been constrained to pass through the origin, is implicitly assumed in the
subsequently provided formulae.
6.3.2.4 regression analysis — A curve-fitting technique from which the calibration curve can be estimated.
SEMI C10-0305 © SEMI 1998, 2005 3
6.3.2.5 Ordinary Least Squares (OLS) — A curve-fitting criterion which, for a given calibration model, minimizes.
2
1
Pr
n
i
i
Yedicted
i
Y
Appropriate use of this criterion implicitly assumes that, on average, each determination is made with equal
reliability.
6.3.2.6 Weighted Least Squares (WLS) — A curve-fitting criterion which, for a given calibration model, minimizes.
.point data the toassigned weight theis where,
2
1
Pr
th
i
i
w
n
i
i
Yedicted
i
Y
i
w
Appropriate use of this criterion implicitly assumes that all w
i
are strictly inversely proportional to each point's
standard deviation (measure of variation).
6.3.2.7 t-statistic — Student’s t is used instead of the Z-statistic (normal distribution) when the standard deviation is
estimated from relatively small quantities of data. It is used herein to explicitly control the risk at 0.13%, regardless
of sample size.
Xs — The concentrations of the standards used in quantifying the MDL.
Ys — The instrument’s response (signal intensity) to each of the Xs in question.
6.3.3 Calculations — OLS and Linear Calibration Model
6.3.3.1 A line, which is not constrained to pass through the origin, is used as the calibration model. OLS is used to
estimate the model. The MDL is located by determining the 3 sigma equivalent Upper Confidence Limit at X = 0
and using a linear calibration model to convert this result into the corresponding concentration (MDL).
Figure 1
Graphical Visualization of MDL
Determination Process