semi合集-English.pdf - 第7252页
SEMI MF525-0705 © SEMI 2003, 2005 15 RELATED INFORMATION 2 PROCEDURE TO ES TIMATE TOTAL RANDOM ERROR NOTICE : This related information is not an official part of SEMI MF525. It w as derived fro m information developed d …
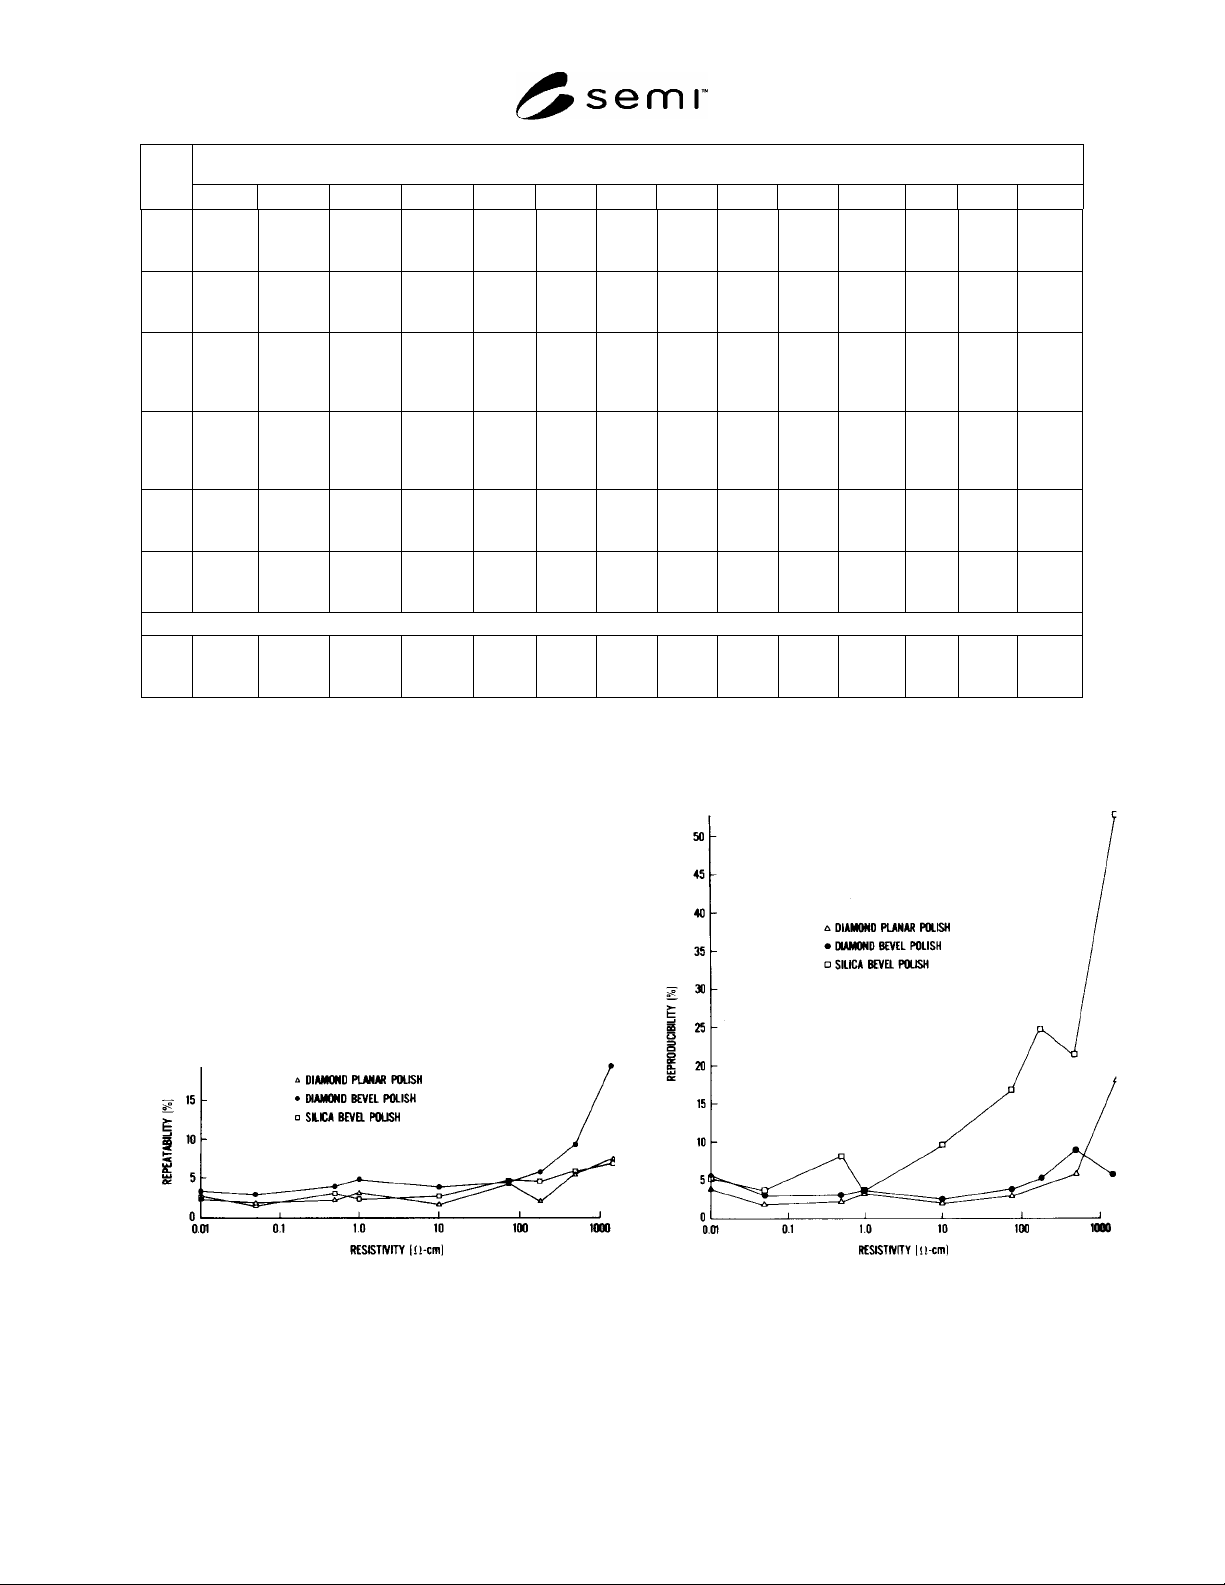
SEMI MF525-0705 © SEMI 2003, 2005 14
Specimen Identification
Lab
#
C D E F G H J K L M N P R T
3
20 g
2.09 k
7.3%
2.3%
22.1 k
4.7%
2.4%
749 k
95.0%
7.1%
327 k
20.0%
8.3%
857
3.7%
2.4%
22.4 k
13.6%
1.5%
28.4 k
8.7%
3.4%
43.9
2.3%
1.2%
5.88
1.6%
1.7%
21.8 k
13.5%
3.0%
270 k
4.9%
5.7%
20.4
1.6%
1.0%
904
2.6%
1.8%
291 k
11.4%
4.4%
3
20 g
baked
1.73 k
9.8%
2.4%
15.3 k
6.7%
1.7%
606 k
27.0%
8.0%
439 k
27.0%
4.0%
75.6
7.6%
2.6%
18.7 k
9.5%
1.8%
16.8 k
6.9%
1.7%
45.9
4.5%
1.5%
6.01
1.1%
2.3%
20.0 k
8.7%
1.8%
403 k
40.0%
5.1%
20.5
2.5%
1.0%
803
5.5%
1.1%
229 k
9.7%
6.5%
7
Instru-
ment
1
2.07 k
5.4%
3.5%
15.6 k
2.4%
2.4%
1.38 M
38.0%
7.8%
665 k
25.0%
5.7%
1.31 k
14.0%
4.7%
20.6 k
14.7%
2.1%
22.1 k
5.3%
4.7%
69.4
9.7%
4.4%
10.5
14.0%
5.8%
22.9 k
7.8%
4.7%
337 k
24.0%
3.6%
30.7
12.0%
1.9%
1.61 k
1.1%
4.6%
181 k
13.0%
3.7%
7
Instru-
ment
2
2.43 k
4.7%
2.5%
14.2 k
4.9%
2.1%
1.40 M
30.0%
5.6%
734 k
18.0%
3.4%
1.11 k
5.3%
3.9%
22.4 k
7.66%
1.8%
14.4 k
5.3%
3.5%
58.2
1.5%
1.8%
9.64
20.0%
4.1%
23.8 k
7.5%
2.2%
303 k
23.0%
3.5%
35.0
4.2%
3.2%
832
0.7%
3.3%
186 k
4.90%
2.9%
15
1.95 k
4.4%
2.3%
13.5 k
6.2%
2.5%
29.7 M
73.0%
6.0%
2.02 M
33.0%
3.2%
641
11.0%
2.6%
16.0 k
3.5%
0.8%
8.00 k
5.6%
1.2%
31.9
2.3%
1.8%
4.64
1.2%
0.6%
22.1 k
3.8%
2.1%
608 k
16.9%
2.7%
15.6
1.2%
0.7%
647
4.7%
2.3%
304 k
16.5%
2.6%
11
3.51 k
11.0%
3.5%
1.37 M
18.0%
9.0%
2.66 M
49.0%
10.0%
1.42 M
50.0%
6.0%
260 k
22.0%
4.6%
33.8 k
16.0%
2.7%
235 k
16.0%
5.8%
1.19 k
26.0%
6.5%
22.6
36.0%
7.4%
27.5 k
5.1%
2.9%
585 k
33.0%
8.1%
89.9
33.0%
5.0%
5.67 k
28.0%
4.4%
327 k
14.0%
3.5%
Aluminum-Oxide Lap
#1
10
1.22 k
3.3%
6.6%
9.79 k
1.6%
12.0%
5.26 M
18.0%
36.0%
981 k
7.9%
8.9%
53.0
8.2%
10.0%
13.0 k
2.8%
5.3%
10.7 k
4.8%
10.0%
41.6
2.3%
7.3%
4.48
6.6%
6.2%
10.5 k
0.8%
6.8%
191 k
3.6%
8.7%
17.1
2.1%
7.2%
588
2.4%
6.2%
89.1 k
4.2%
7.2%
#1
In each box, the first value is grand average spreading resistance value (for the record only, not used in analysis of test); second entry is
“reproducibility,”
R
, that is, the percent relative standard deviation of four averages (of 25 measurements each), the third entry is the
“repeatability,”
r
, that is, the average of four relative standard deviations (of sets of 25 measurements).
#2
Reported graphical data and averages;
r
could not be calculated.
(b) Reproducibility (a) Repeatability
Figure R1-1
Round-Robin Averages as a Function of Resistivity and Specimen Preparation
SEMI MF525-0705 © SEMI 2003, 2005 15
RELATED INFORMATION 2
PROCEDURE TO ESTIMATE TOTAL RANDOM ERROR
NOTICE: This related information is not an official part of SEMI MF525. It was derived from information
developed during the original preparation of the standard in ASTM Committee F-1 on Electronics in 1977. This
related information was approved for publication by full letter ballot procedures.
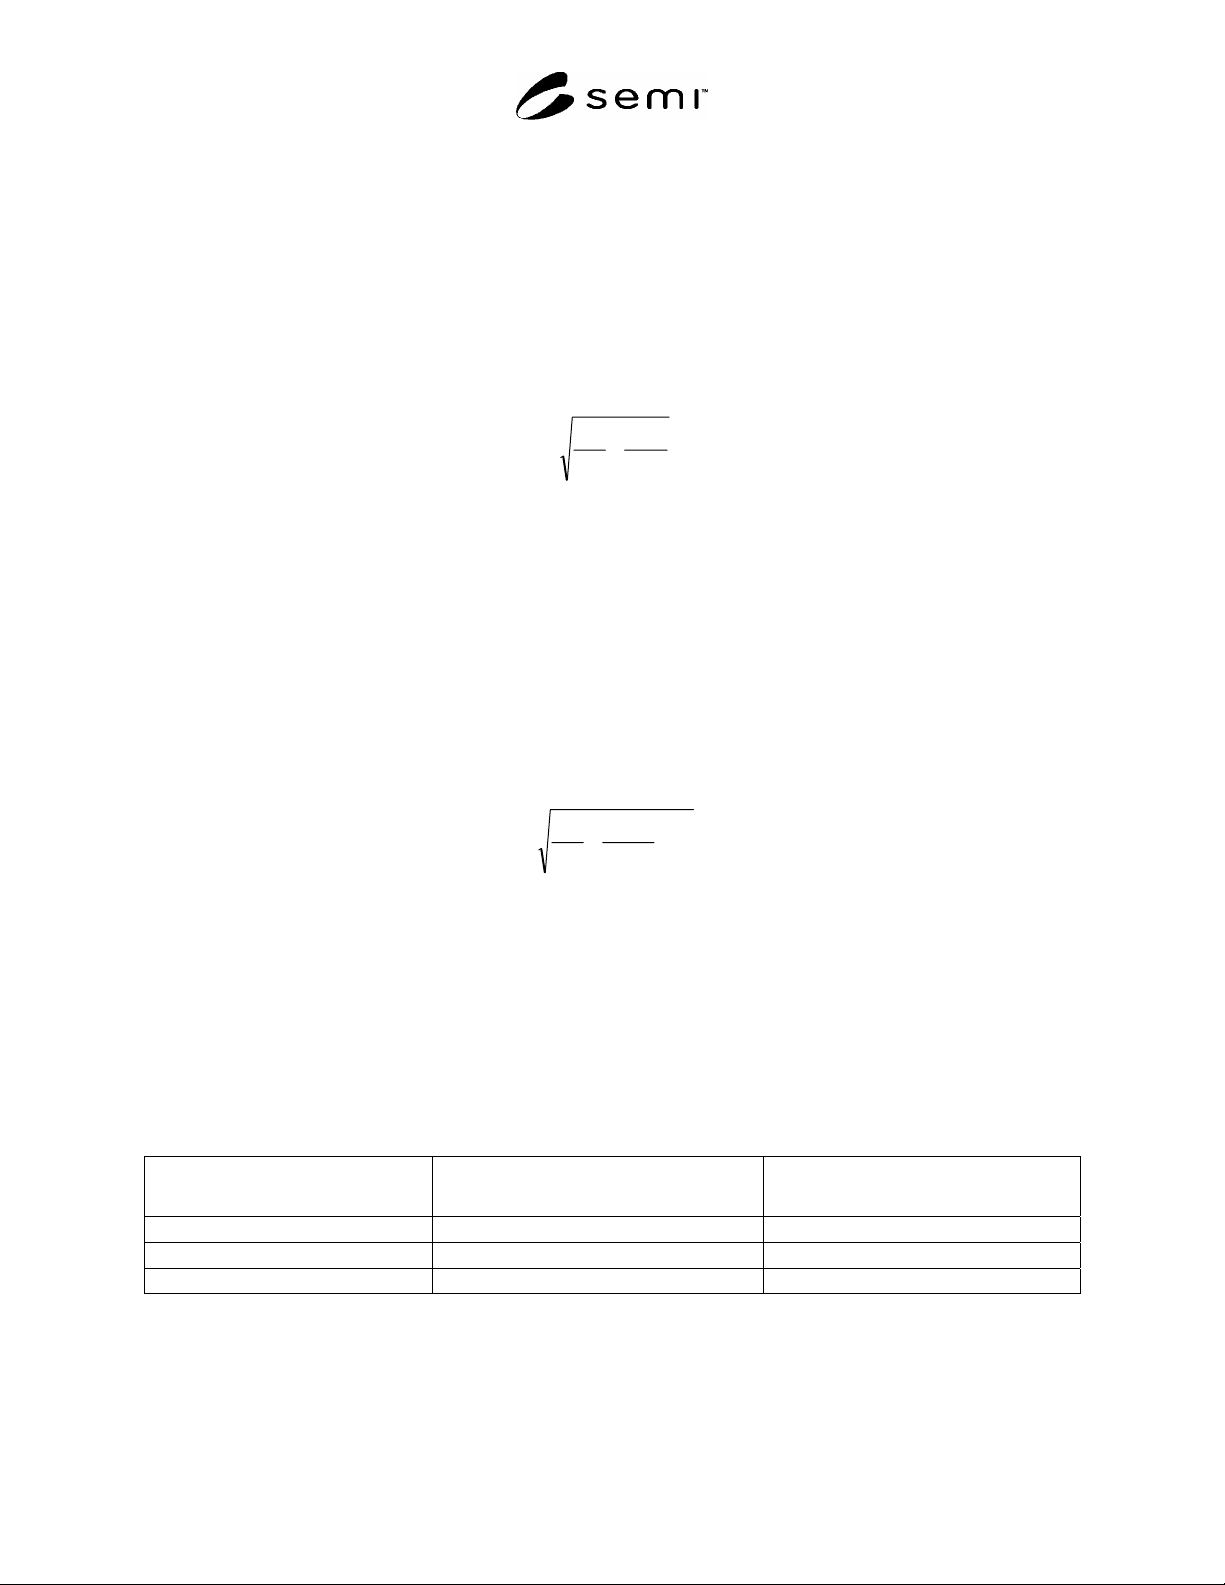
R2-1 Estimates of repeatability,
r
, and reproducibility,
R
, may be combined as follows to estimate the total
random error,
t
, to be experienced in the spreading resistance measurements of a single test specimen by a
laboratory in control of the measurement process.
rp
r
p
R
t
nnn
2
2
(R2-1)
where:
r
= repeatability for the chosen specimen preparation (see Table 1),
R
= reproducibility for the chosen specimen preparation (see Table 1),
n
p
= number of specimen preparations, and
n
r
= number of measurement replications that are performed by the laboratory after each specimen preparation.
R2-2 An additional source of random error, due to the variability of the four-point probe measurement of resistivity,
must be considered when determining the total random error uncertainty,
c
, of a point on the spreading resistance
calibration relation. Although this additional term is an error in resistivity value, not in spreading resistance value, it
is a small additional error, and a reasonable simplifying approximation for the combined random error uncertainty
for a calibration specimen is:
2
2
2
s
mmm
rp
r
p
R
c
(R2-2)
where:
r
= repeatability for the chosen specimen preparation (see Table 1),
R
= reproducibility for the chosen specimen preparation (see Table 1),
s = estimate of four-point probe measurement precision given in SEMI MF84 and summarized in Table R2-1,
m
p
= number of preparation replications on the calibration specimens, and
m
r
= number of spreading resistance measurement replications on the calibration specimens.
Table R2-1 Precision (Random Error) of Four-Point Probe Resistivity Measurement that Contributes to
Spreading-Resistance Calibration Error
Specimen Resistivity,
·cm
Three-Sigma Four-Point Probe Precision
from SEMI MF84
One-Sigma Precision to be used for s in
Equation R2-2
0.0008 to 120 2% 0.7%
120 to 500 5% 1.7%
500 to 2000 15% 5%
SEMI MF525-0705 © SEMI 2003, 2005 16
R2-3 Propagation of Random Error and Uncertainty of Resistivity Values When Determining Test Specimen
Resistivity by Calibrated Spreading Resistance Measurements
R2-3.1 If the entire calibration procedure (or just a part containing specimens of a limited range of resistivity values
of interest) is performed once for each test specimen measured, the random errors for the measurement of both test
and calibration specimens are statistically independent and can be added in root-mean-square fashion to estimate the
total random error uncertainty, s
T
, in the derived resistivity value of a test specimen:
22
ctT
s
(R2-3)
R2-3.1.1 The associated 95% confidence interval for resistivity values derived from spreading resistance
measurements, considering only random sources of error, is given by S
T
= 1.96 s
T
, or approximately by 2s
T
.
R2-3.2 If the calibration procedure is performed once, and a number of test specimens are then measured before
calibration is performed again, the random errors are not independent and the errors cannot be combined in the
above fashion. In this case, the “random” errors on the calibration specimen act as short-term systematic errors: the
errors for some calibration specimens are on the high side, the errors for others are on the low side, and they will be
fixed until the next calibration. If this situation obtains, a reasonable estimate of the 95% confidence interval for
derived resistivity values, due to what are normally random errors, is given by:
ctT
S
2 (R2-4)
where
t
and
c
are obtained from Equations R2-1 and R2-2.
R2-4 Examples of Use of Propagation of Error Equations to Estimate the 95% Confidence Limits (Due to Random
Error Only) for the Resistivity Values of a Test Specimen
R2-4.1 Assumptions — One preparation each of test specimens and of calibration specimens (n
p
= m
p
= 1); ten
measurements are taken and averaged on the calibration specimens closest in resistivity to the test specimen (m
r
=
10; five measurements are taken and averaged on the test specimen (n
r
= 5); the test specimen has a resistivity of
approximately 1 ·cm: s = 0.7%; diamond bevel polishing is used (
r
= 6.3%,
R
= 6.2%).
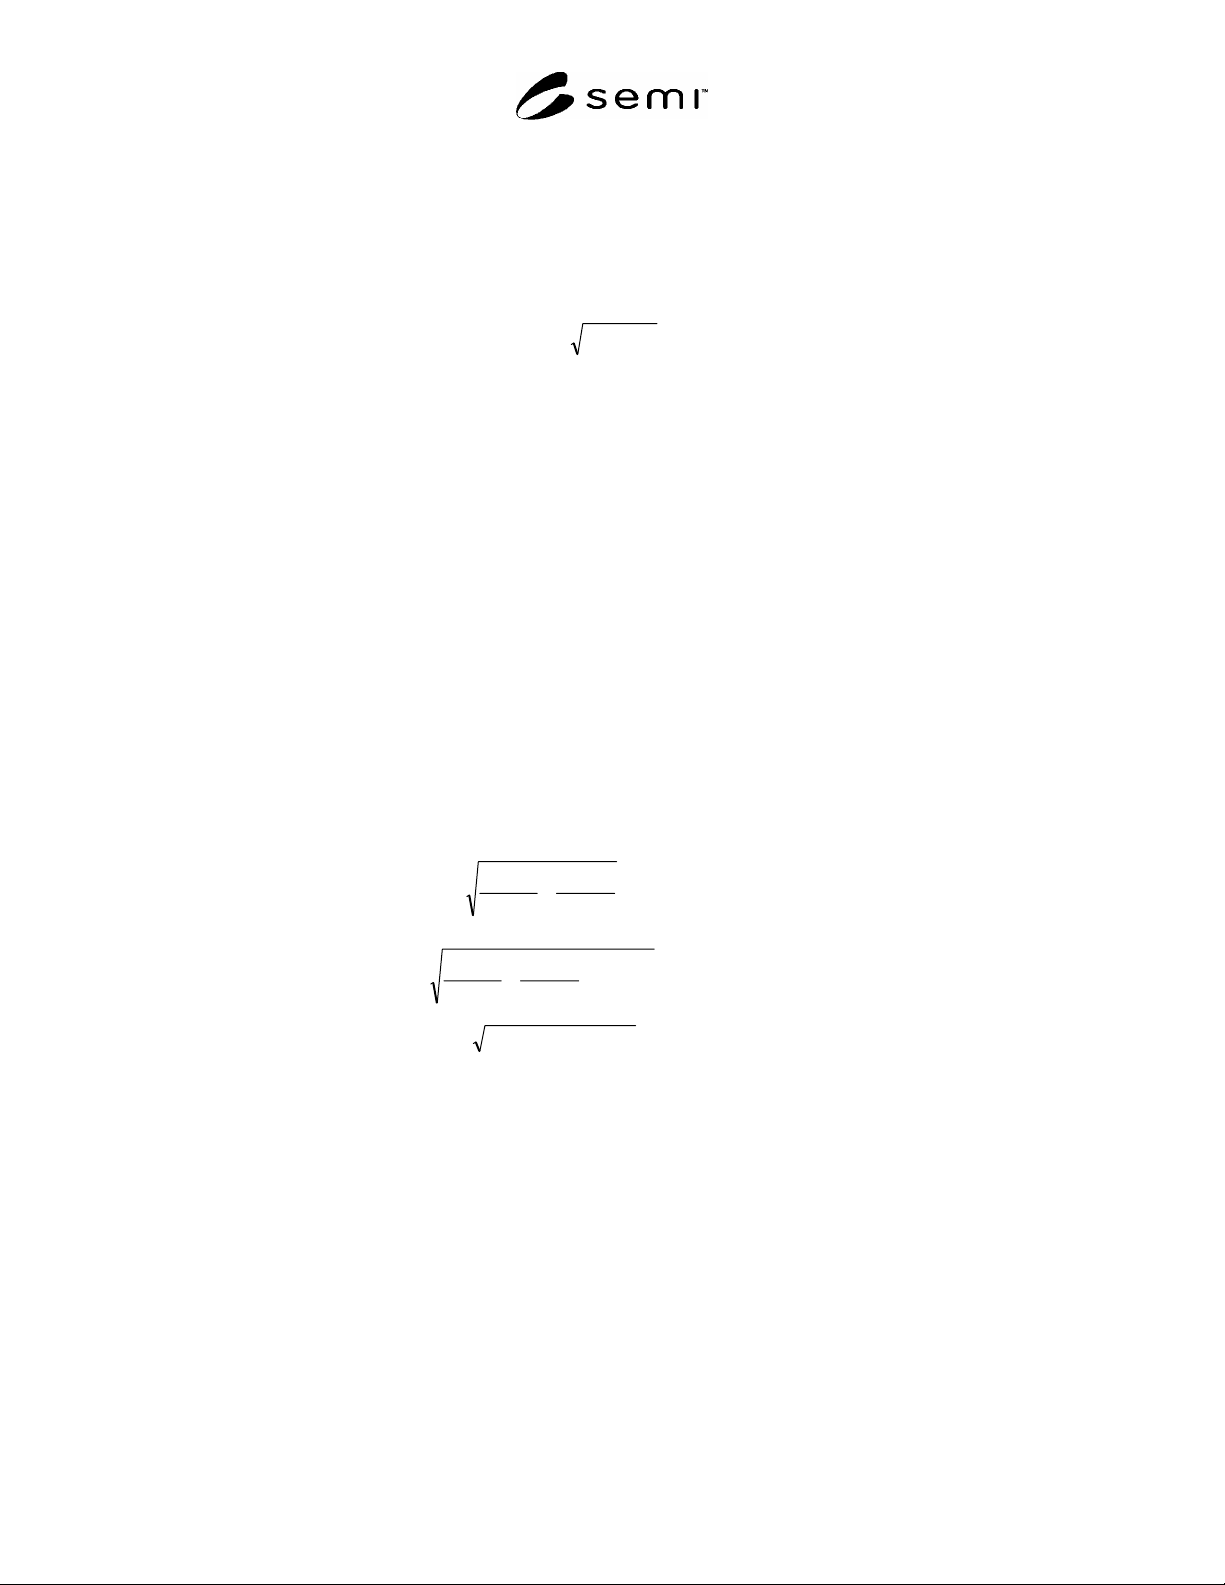
R2-4.2 Case I — Calibration measurements are always taken prior to measurement of each test specimen.
%88.60688.0
51
062.0
1
063.0
22
t
%64.60664.0007.0
101
062.0
1
063.0
2
22
c
%1.19191.00664.00688.02
22
T
S
R2-4.3 Case II — Calibration measurements are not taken prior to each test specimen measurement.
%0.27270.00664.00688.02
T
S
R2-5 Equations R2-1 through R2-4 may also be used to estimate the random error in the measurement process
based only on measurements in a single laboratory. In this case the values of
r
and
R
to be used must be
determined through appropriate replicate experiments using the desired measurement conditions in that laboratory.