semi合集-English.pdf - 第7325页
SEMI MF1239-0305 © SEMI 2003, 2005 7 oxygen concentration, partial pr ecipitation occurs (in this transition region, oxygen reduction chang es rapidly with increasing initial oxygen concen tration); at high initial oxy g…
SEMI MF1239-0305 © SEMI 2003, 2005 6
12.2.1.3 If the average oxygen reduction values of the groups tested agree to within a desired amount, consider the
groups equivalent.
12.2.2 Method 2
12.2.2.1 Use this method to de-couple oxygen content and precipitation behavior to obtain (1) a qualitative
overview of the precipitation characteristics of the groups tested and (2) the important features of the characteristic
precipitation curve.
12.2.2.2 Bin the oxygen reduction data for each group so that all wafers with oxygen concentration within each 0.5
ppma interval are included in the same bin.
12.2.2.3 Calculate the average of the initial oxygen concentration and the oxygen reduction for each bin in each
group.
12.2.2.4 Plot the average oxygen reductions against average initial oxygen concentrations for each group tested.
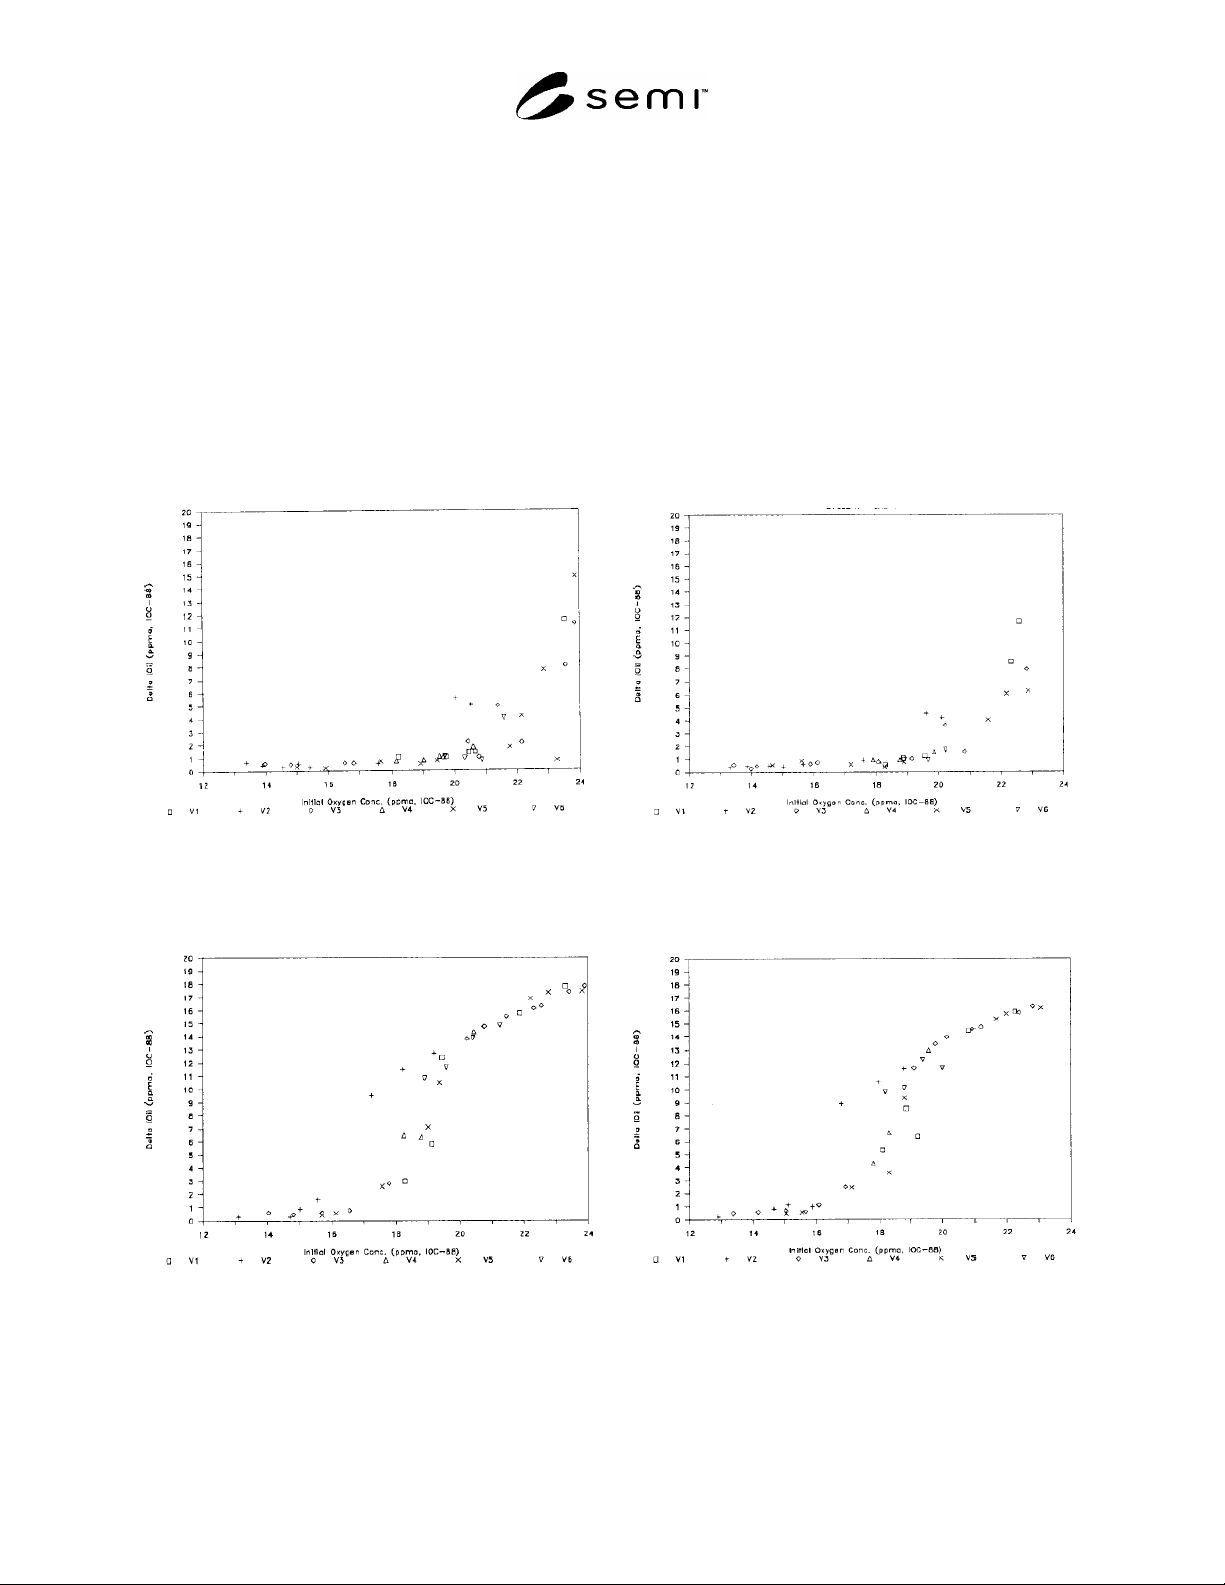
Use a different symbol to distinguish the data for each group. See Figures 2 through 5 for examples of such plots.
Figure 2
Oxygen Reduction in Wafers from Six Groups (V1
to V6) Following Exposure to One-Step Cycle A as
Measured by Laboratory 3
Figure 3
Oxygen Reduction in Wafers from Six Groups (V1
to V6) Following Exposure to One-Step Cycle A as
Measured by Laboratory 4
Figure 4
Oxygen Reduction in Wafers from Six Groups (V1
to V6) Following Exposure to Two-Step Cycle B as
Measured by Laboratory 3
Figure 5
Oxygen Reduction in Wafers from Six Groups (V1
to V6) Following Exposure to Two-Step Cycle B as
Measured by Laboratory 4
12.2.2.5 Note that the curves have three characteristic regions, as illustrated by distinct slope change in Figure 4 and
Figure 5. At low initial oxygen concentration, there is essentially no oxygen reduction; at some value of initial

SEMI MF1239-0305 © SEMI 2003, 2005 7
oxygen concentration, partial precipitation occurs (in this transition region, oxygen reduction changes rapidly with
increasing initial oxygen concentration); at high initial oxygen concentration, full precipitation occurs (in this
region, oxygen reduction is proportional to initial oxygen concentration).
12.2.2.6 Compare the curves obtained for each group. If the data for each group falls within a band of suitable
width, consider the groups equivalent.
13 Report
13.1 Report the following for each group tested:
13.1.1 Identification of group (lot number, location of measurement point on wafer, center or edge, etc.),
13.1.2 Dates of initial and final oxygen measurement and of the heat treatment and identification of operators for
measurement and heat treatment,
13.1.3 Identification of infrared spectrophotometer used,
13.1.4 Table of initial and final oxygen concentrations for each wafer measured, and
13.1.5 Averages and standard deviations of the initial oxygen content and oxygen reduction for each group tested.
13.2 In addition, if Method 2 was used, report the following:
13.2.1 Table of average initial oxygen concentration and average oxygen reduction for each bin in each group, and
13.2.2 Graph of average oxygen reductions against average initial oxygen concentrations for each group.
14 Precision
14.1 Wafers from six different groups with different back surface conditions were processed in two laboratories and
combined. Both Cycles A and B were used. Measurements of initial and final oxygen concentrations on all wafers
tested were made at two other laboratories.
14.2 The wafers within each group did not meet the 2-wafer per 0.5 ppma interval required by these test methods.
14.3 Nevertheless, from the plots reproduced as Figures 2 through 5, both measurement laboratories (that employed
different FT-IR spectrophotometers for making the oxygen determinations at the center of the wafers only)
concluded that the wafers from Groups V1, V3, V4, V5, and V6 were essentially equivalent but those from Group
V2 had increased precipitation in the transition region.
15 Bias
15.1 No reference standards are available for precipitated oxygen, so it is impossible to determine bias except for
that of the individual oxygen measurements. Bias of the individual oxygen measurements should be determined in
accordance with the procedures of the test method utilized.
16 Keywords
delta [O
i
]; interstitial oxygen; oxygen precipitation; oxygen reduction; silicon ; [O
i
]
NOTICE: SEMI makes no warranties or representations as to the suitability of the standards set forth herein for any
particular application. The determination of the suitability of the standard is solely the responsibility of the user.
Users are cautioned to refer to manufacturer's instructions, product labels, product data sheets, and other relevant
literature, respecting any materials or equipment mentioned herein. These standards are subject to change without
notice.
By publication of this standard, Semiconductor Equipment and Materials International (SEMI) takes no position
respecting the validity of any patent rights or copyrights asserted in connection with any items mentioned in this
standard. Users of this standard are expressly advised that determination of any such patent rights or copyrights, and
the risk of infringement of such rights are entirely their own responsibility.
Copyright by SEMI® (Semiconductor Equipment and Materials
International), 3081 Zanker Road, San Jose, CA 95134. Reproduction of
the contents in whole or in part is forbidden without express written
consent of SEMI.

SEMI MF1366-0305 © SEMI 2003, 2005 1
SEMI MF1366-0305
TEST METHOD FOR MEASURING OXYGEN CONCENTRATION IN
HEAVILY DOPED SILICON SUBSTRATES BY SECONDARY ION MASS
SPECTROMETRY
These test methods were technically approved by the Global Silicon Wafer Committee and are the direct
responsibility of the North American Silicon Wafer Committee. Current edition approved for publication by
the North American Regional Standards Committee on December 10, 2004. Initially available at
www.semi.org January 2005; to be published March 2005. Original edition published by ASTM
International as ASTM F 1366-92. Last previous edition SEMI MF1366-02.
1 Purpose
1.1 The presence of oxygen can be beneficial to certain manufacturing operations by preventing the formation of
process-induced defects. Oxygen is introduced into silicon wafers during the crystal growing process. Hence, it is
very important to control the oxygen content of silicon crystals.
1.2 SIMS can measure the oxygen concentration in heavily-doped silicon substrates used for epitaxial silicon where
the free carrier concentration obscures the infrared absorption and prevents the normal use of the infrared
measurement as a characterization technique for the commercial production of silicon.
1.3 The SIMS measurement allows for the production of controlled oxygen content in heavily-doped silicon
crystals.
1.4 This test method can be used for process control, research and development, and materials acceptance purposes.
2 Scope
2.1 This test method covers the determination of total oxygen concentration in the bulk of single crystal silicon
substrates using secondary ion mass spectrometry (SIMS).
2.2 This test method can be used for silicon in which the dopant concentrations are less than 0.2% (1 × 10
20
atoms/cm
3
) for boron, antimony, arsenic, and phosphorus (see SEMI MF723). This test method is especially
applicable for silicon that has resistivity between 0.0012 and 1.0 ·cm for p-type silicon and between 0.008 and 0.2
·cm for n-type silicon (see SEMI MF43).
2.3 This test method can be used for silicon in which the oxygen content is greater than the SIMS instrumental
oxygen background as measured in a float zone silicon sample, but the test method has a useful precision especially
when the oxygen content is much greater (approximately 10× to 20×) than the measured oxygen background in the
float zone silicon.
2.4 This test method is complementary to infrared absorption spectroscopy that can be used for the measurement of
interstitial oxygen in silicon that has resistivity greater than 1.0 ·cm for p-type silicon and greater than 0.1 ·cm
for n-type silicon (see SEMI MF1188). The infrared absorption measurement can be extended to between 0.02 and
0.1 ·cm for n-type silicon with minor changes in the measurement procedure.
1
2.5 In principle, different sample surfaces can be used, but the precision estimate was taken from data on chemical-
mechanical polished surfaces.
NOTICE: This standard does not purport to address safety issues, if any, associated with its use. It is the
responsibility of the user of this standard to establish appropriate safety and health guides and determine the
applicability of regulatory or other limitations prior to use.
3 Limitations
3.1 Oxygen from silicon oxide, carbon oxide, and water on the surface can interfere with the oxygen measurement.
3.2 Oxygen adsorbed from the SIMS instrument chamber to the surface can interfere with the oxygen measurement.
1 Hill, D. E., “Determination of Interstitial Oxygen Concentration in Low-Resistivity n-type Silicon Wafers by Infrared Absorption
Measurements,” J. Electrochem. Soc. 137, 3926 (1990).