semi合集-English.pdf - 第7338页
SEMI MF1389-0704 © 2004 6 onset point as permissible from signal-to-noise considerations. Plot the EHD lumin escence intensity at 8720 cm − 1 versus the laser intensity u sed on linear axes. The EHD onset power can be de…
SEMI MF1389-0704 © 2004 5
10 Instrument Calibration
10.1 Measurement of silicon standards need only be
performed once unless instrument characteristics have
drifted or hardware changes have been made. The
regular use of secondary standard samples, herein
referred to as audit samples, provides a mechanism for
instrument calibration verification and generates long-
term instrument performance statistics. At least four
standard samples should be used for each impurity
calibration curve adjustment.
10.1.1 Obtain samples with known impurity densities
and collect luminescence spectra at the appropriate
excitation intensity listed in Section 11.1 using both
standard and high resolution as listed in Section 11.2.2.
10.1.2 Find the peak intensities as described in Section
12 and find the ratios of appropriate spectral lines as
described in Section 13.1.
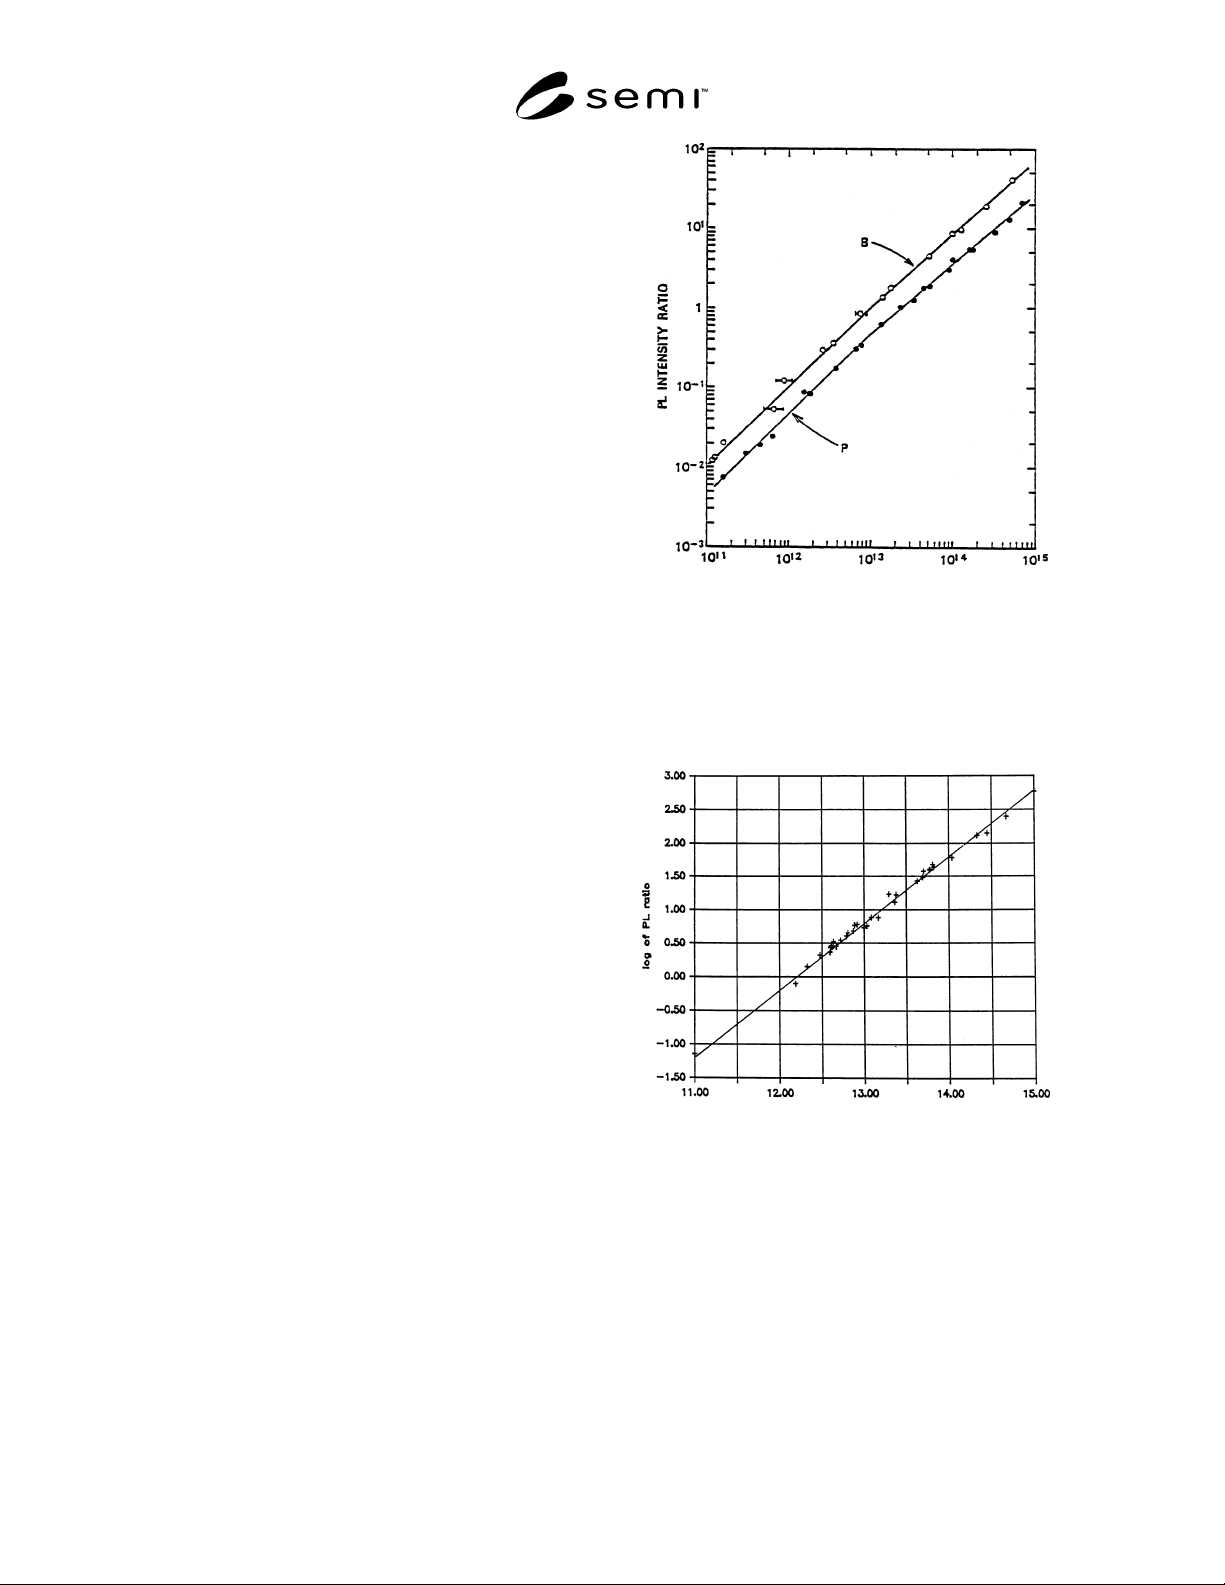
10.1.3 Adjust calibration data of Figure 1 or Figure 2,
corresponding to Test Method A or Test Method B,
respectively, by translating the curves such that they
intersect points corresponding to PL data of the known
samples. Make no change to the slope of the curves
because the slopes are a function of the exciton
recombination dynamics only and are independent of a
given instrument’s optical response.
10.1.4 These curves become the given instrument’s
calibration curves for the analysis conditions used.
10.2 Determine the short-term one-sigma precision of
the instrument.
NOTE 3: This procedure needs to be performed only
occasionally unless instrument characteristics have drifted or
hardware changes have been made.
10.2.1 Analyze a sample with impurity concentrations
similar to typical samples analyzed by the instrument in
normal operation nine times.
10.2.2 Find the peak intensity as described in Section
12 to obtain dopant densities.
10.2.3 Calculate the open-sigma standard deviation for
all impurities present.
11 Procedure
11.1 Excitation Conditions
11.1.1 Test Method A—High Excitation Intensity
Conditions — Set the output of the argon ion laser to
300 mW of 514.5 nm light. Pass the beam through an
infrared cutoff filter and a chopper with a 50% duty
cycle. Beam can be reflected with 2 to 3 mirrors with a
nominal 1-m distance between sample and laser. Pass
the unfocused beam through the cryostat windows. Set
the beam diameter to 2.5 mm.
DOPAN T DEN SI TY (c m
−
3
)
NOTE: The PL intensity ratio of P
TO
(BE)/I
TO
(FE) and
B
TO
(BE)/I
TO
(FE) are plotted against the P and B dopant
densities, respectively.
11
Figure 1
High Excitation Condition Impurity Calibration
Curves for Boron and Phosphorus (Test Method A)
log of dopa nt de nsit y (c m
−
3
)
NOTE: Slope = 1.0.
Figure 2
Low Excitation Condition Generic Impurity
Calibration Curve (Test Method B)
11.1.2 Test Method B—Low Excitation Intensity
Conditions — Set laser intensity such that the
luminescence is as close to the EHD onset point as
practical from signal-to-noise considerations. Collect
luminescence spectra of the sample used in Section
10.2 at several different laser beam intensities,
extending from well above to as far below the EHD
SEMI MF1389-0704 © 2004 6
onset point as permissible from signal-to-noise
considerations. Plot the EHD luminescence intensity at
8720 cm
−1
versus the laser intensity used on linear axes.
The EHD onset power can be determined by
extrapolating the nonzero EHD points down to zero
intensity using a straight line.
9
11.2 Spectrometer Parameters
11.2.1 Spectral Ranges Required (minimum)
TO region—8757–8889 cm
−1
(1142–1125 nm)
NP region—9242–9294 cm
−1
(1082–1076 nm)
11.2.2 Resolution
Standard resolution = 2 cm
−1
(or 0.2 nm)
High resolution = 0.5 cm
−1
(or 0.05 nm)
Use standard resolution when calculation of aluminum
or arsenic concentrations is not desired or not
necessary. Otherwise, use high resolution.
11.3 Audit Specimen Analysis — Keep one set of
specimens as secondary standards to periodically check
instrument performance. Make sure that at least one of
these samples reflects typical material properties for the
laboratory concerned. Analyze at least one of these
samples with each batch of unknown samples to
confirm reproducibility of analysis conditions from run
to run.
11.3.1 Collect luminescence spectra of audit specimens
before unknown samples, preferably in the same sample
holder batch using parameters listed in Sections 11.1
and 11.2.2. Reduce spectral data as described in Section
12.
11.3.2 If the audit specimen results fall outside the
acceptable control limits established for an instrument,
the laser power may be adjusted to compensate for drift
in the optical transfer efficiency of the sample
excitation subsystem. If the source of drift cannot be
ascribed to this simple mechanism, thoroughly
investigate and correct the problem. Instrument
recalibration may be required.
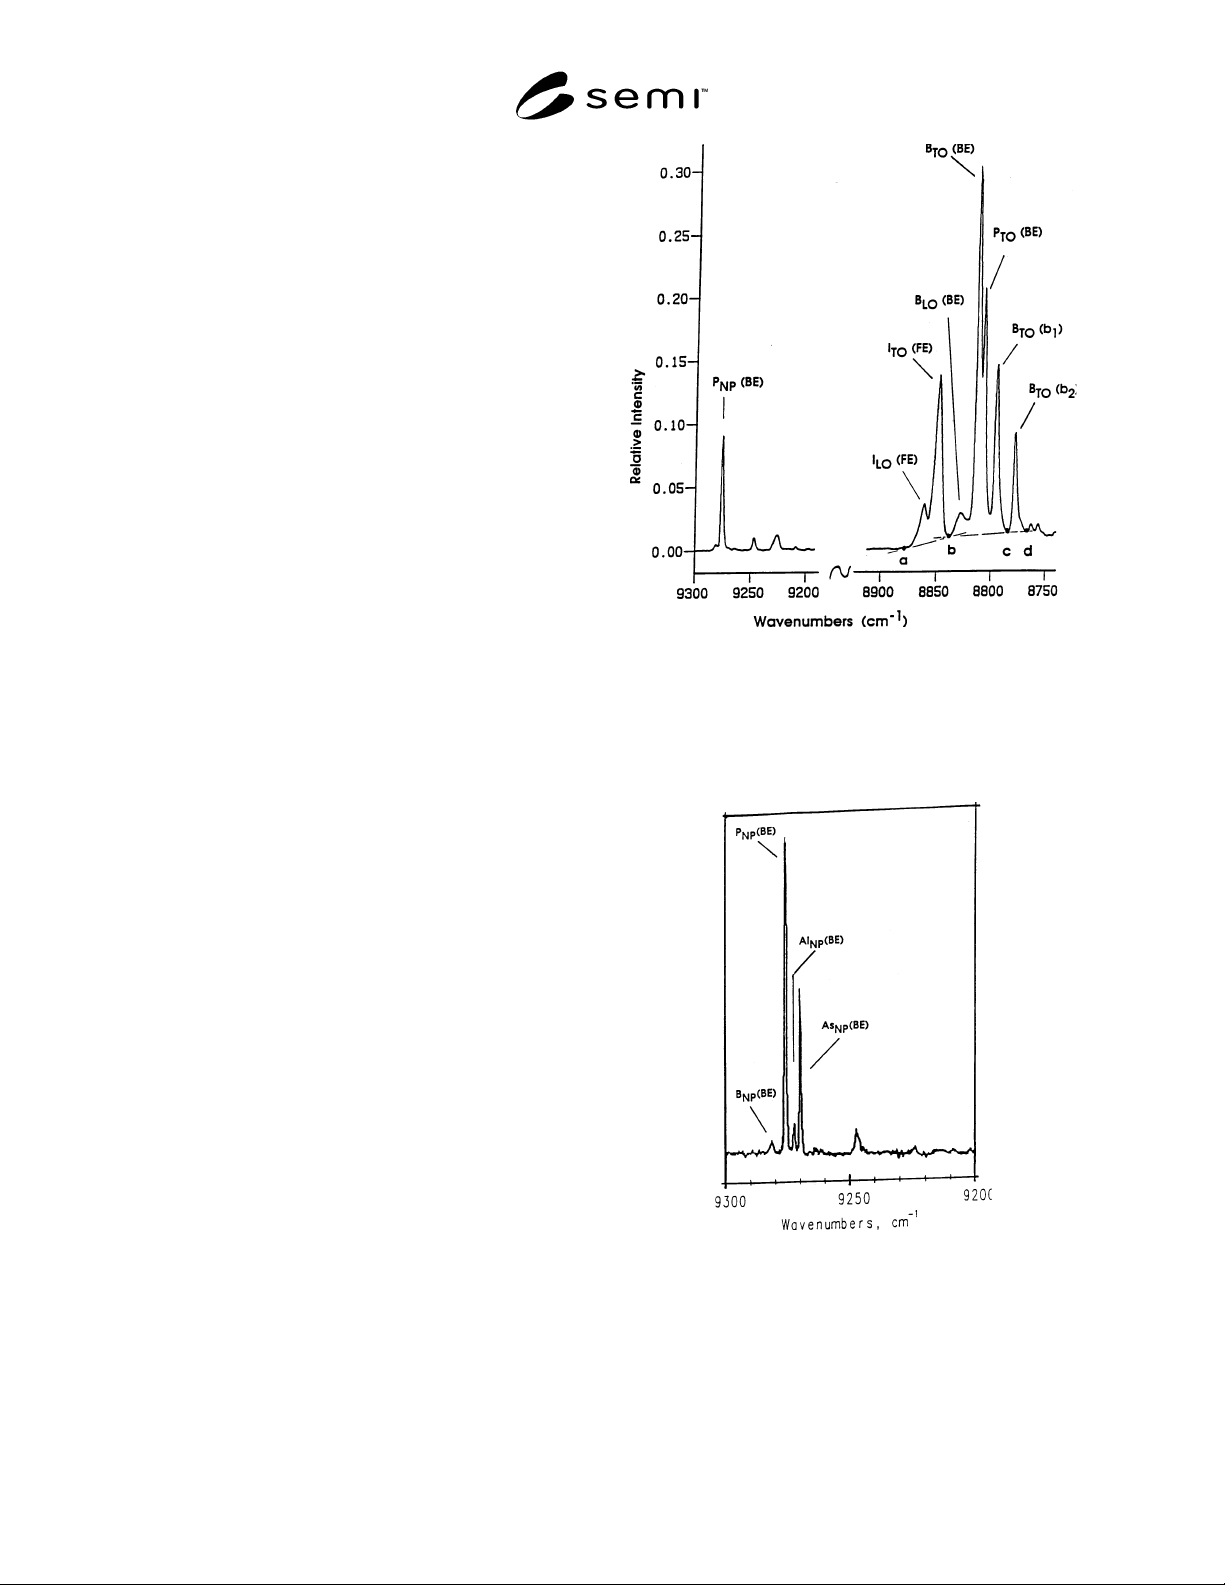
Figure 3
Baseline Drawing Example
11.4 Collect luminescence spectra of unknown samples
with spectrometer parameters as listed in Section 11.2.
Find the peak intensity as described in Section 12.
Figure 4
High-Resolution (0.5 cm
−1
) Spectrum of
NP (No-phonon) Region
12 Peak Intensity Determination
12.1 Use the baseline drawing method depicted in
Figure 3. For the I
TO
(FE) line, draw the baseline
between (a), the point at 8880 cm
−1
, and (b), the point

SEMI MF1389-0704 © 2004 7
at the minimum near 8840 cm
−1
. For the TO region
impurity lines, draw a line from (b) to (c) or (d): the
minimum near 8785 cm
−1
or 8768 cm
−1
, whichever is
lower.
12.2 Measure peak heights or areas. Use TO lines for B
and P. Use NP lines for Al and As. If the P
TO
(BE) is
not usable, also use NP lines for P.
12
See Figure 4 for
identification of bands in the NP region.
12.3 Correct for the P
TO
(b
1
′) line underlying the
B
TO
(BE) line by subtracting one-tenth of the intensity
of the P
TO
(BE) line from the B
TO
(BE) line intensity.
13 Calculation
13.1 Calculate the ratio of the extrinsic line intensity to
the I
TO
(FE) line intensity for each impurity present.
13.2 Using the adjusted calibration curves obtained in
Section 10.1.3 find the point on the calibration curve
corresponding to the ratio (or log of the ratio, as
appropriate) obtained in Section 13.1 by graphical or
numerical methods.
13.3 Record the corresponding value of dopant density
in atoms/cm
3
.
14 Report
14.1 Report the following each time the instrument is
calibrated using primary or secondary standard
samples:
14.1.1 Standard sample ratios obtained in Section
10.1.2, and
14.1.2 Square Root of Mean Square, (RMS) precision
data obtained in Section 10.2.3
14.2 Report the following each time a load of samples
is run:
14.2.1 Audit specimen dopant density results,
14.2.2 Unknown ample dopant density results,
14.2.3 Sample lot number, number of samples, operator
name, and date of analysis, and
14.2.4 Test Method used (A or B).
15 Precision
15.1 A single laboratory investigation of the precision
of measurement of phosphorus and boron by photolu-
minescence was conducted on a Fourier transform
instrument. Two samples were analyzed once a day
12 Tajima, M., Masui, T., Itoh, D., and Nishino, T.,“ Calibration of
the Photoluminescence Method for Determining As and Al
Concentrations in Si,” Journal of Electrochemical Society, Vol 137,
1990, pp. 3544–3551.
over a period of several weeks (45 measurement values
were taken on each sample). The first sample contained
a nominal 70 ppta phosphorus and a nominal 30 ppta
boron; and the second sample contained a nominal 20
ppta phosphorus and a nominal 15 ppta boron. From
this multiple-day, two-operator, two-sample investiga-
tion, values of single laboratory standard deviation and
relative standard deviation based on the average
measured value were obtained and are tabulated in
Table 3.
Table 3 Standard Deviation Values for a Single
Laboratory Study of Variation of
Photoluminescence Measurements of Phosphorus
and Boron
Sample Dopant 1s, ppta R1s, percent
1 Phosphorus 2.43 3.4
1 Boron 1.69 6.2
2 Phosphorus 1.13 5.6
2 Boron 1.00 7.0
16 Bias
16.1 The bias of this test method cannot be evaluated
because there are no available reference standards
suitable for evaluating bias.
17 Keywords
17.1 aluminum; arsenic; boron; dopant; impurities;
impurity analysis; phosphorus; photoluminescence;
silicon.