semi合集-English.pdf - 第7713页
SEMI T10-0701 © SEMI 2001 6 7.4 Mark Growth 7.4.1 Ma rk Gro wth is co ncer ned wit h t ra cki ng the tend ency of a ma rking s yste m to o ver o r under mark t he symbol. This is a size com p arison between the actual ma…
SEMI T10-0701 © SEMI 20015
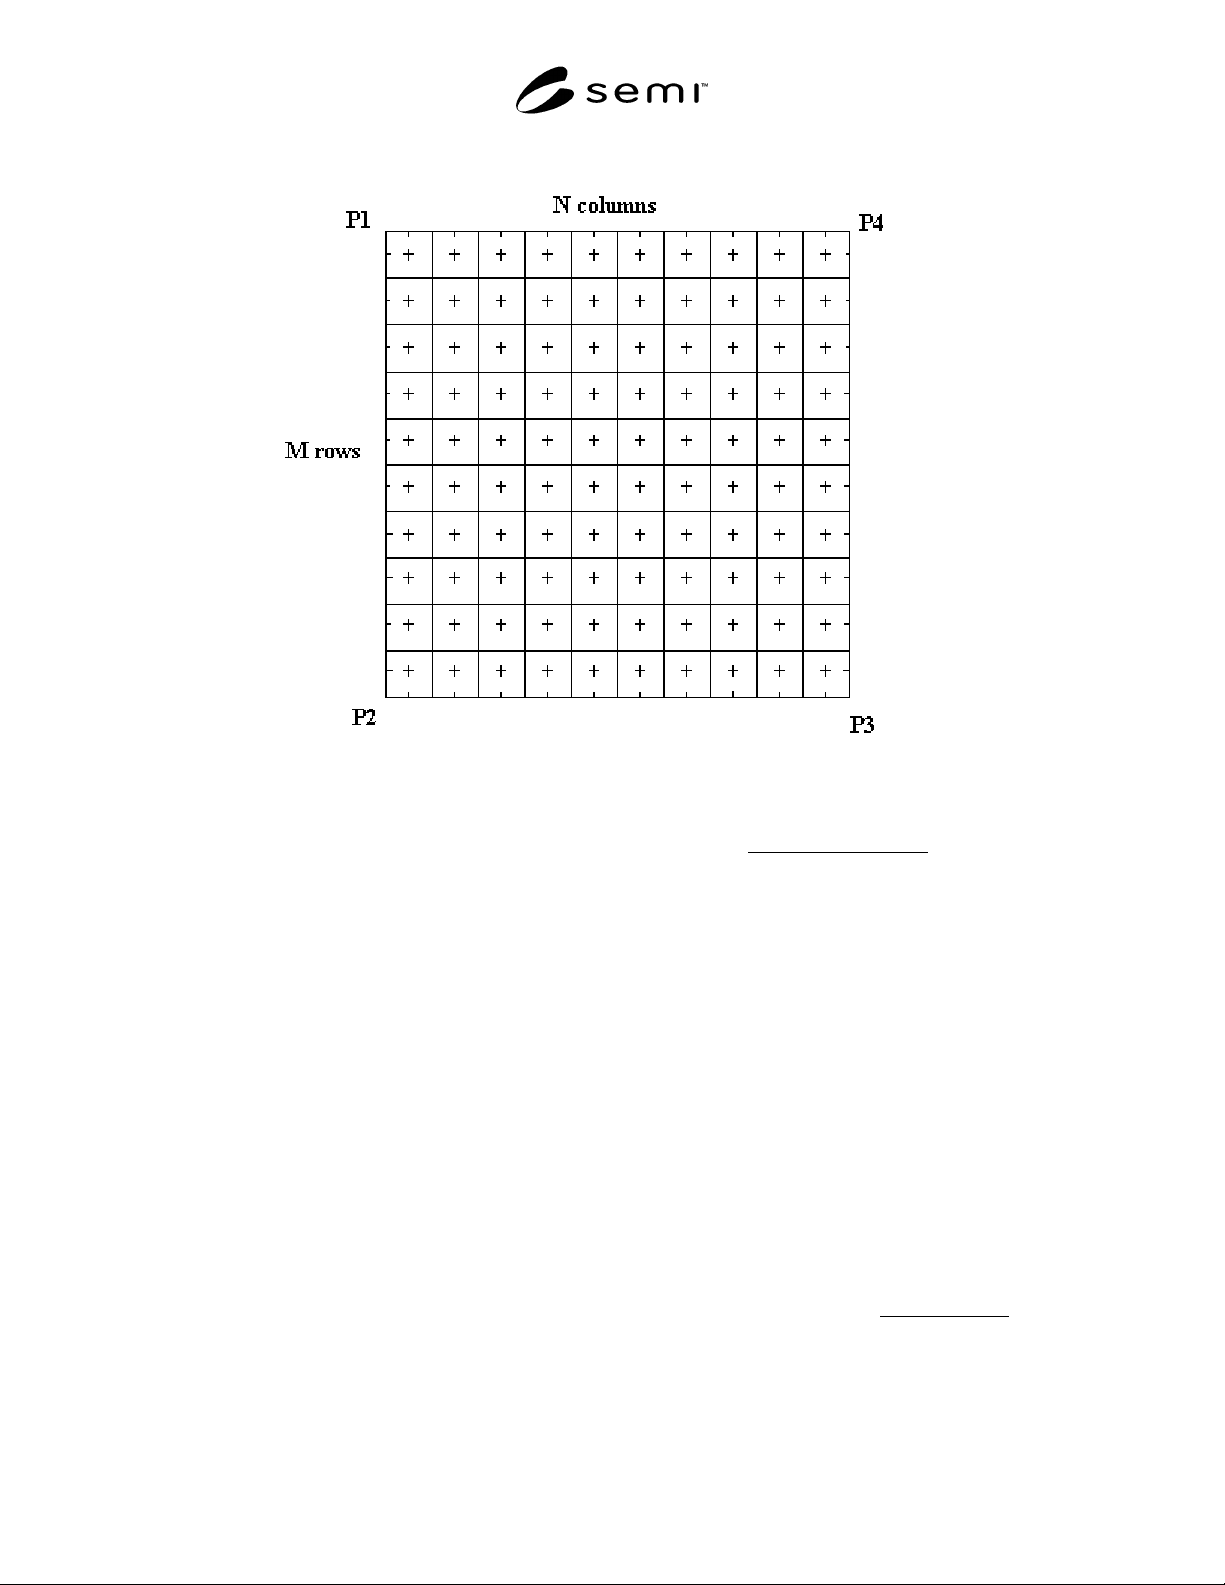
Figure 4
Matrix Cell Center Locations
7.2 Symbol Contrast
7.2.1 Symbol Contrast measures the distinctiveness of
the two reflective states in the symbol, namely light and
dark. Many aspects of the mark/reader configuration
affect the resulting symbol contrast in the image.
7.2.2 Within the grayscale image, se lect all of the
image pixels, which fall within the area of the symbol,
extending outward to the limits of any required quiet
zones. Sort the selected pixels by their reflectance
values into a histogram. Calculate the arithmetic mean
of the reflectance histogram. Use this mean value to
separate the reflectance histogram into 2 sections or
sub-histograms, which represent approximate
reflectance histograms for the dark and light contrasts
of the symbol. Calculate the arithmetic mean of each
sub-histogram. The lower grayscale value of the two
means represents the dark grayscale value G
D
and the
higher value represents the light grayscale value G
L
.
Use these two grayscale values to calculate a new
symbol contrast. The difference of the grayscale levels
divided by the full range of grayscale (255 in the case
of 8 bit A/D Sampling) is the Symbol Contrast. Report
the Symbol Contrast value.
100%
Range(255)Grayscale
D
G
L
G
SC ×
−
= (1)
7.3
Symbol Contrast Signal to Noi se Ratio (SNR)
7.3.1 The Symbol Contrast Signal to Noise Ratio
(SNR) is a relative measure of the symbol contrast
(signal) to the maximum deviation in the light or dark
grayscale level in the symbol (noise). Using the sub-
histograms and the two grayscale values G
L
and G
D
found in the Symbol Contrast calculation, calculate the
deviation of each sub-histogram about each respective
grayscale value. Two values will result: the deviation
of light pixels D
L
and the deviation of dark pixels D
D
.
Calculate a symbol contrast difference in grayscale
value using the grayscale values. Divide this contrast
difference by the maximum deviation calculated for the
individual light and dark sections of the histogram.
This ratio is the Symbol Contrast SNR. Report the
symbol contrast SNR.
()
D
D,
L
DMax
D
G
L
G
SNRContrastSymbol
−
= (2)
SEMI T10-0701 © SEMI 2001 6
7.4 Mark Growth
7.4.1 Mark Growth is concerned wit h tracking the
tendency of a marking system to over or under mark the
symbol. This is a size comparison between the actual
marked cells vs. their nominal size. Changes in mark
growth can be indicative of changes in the marking
process or substrate characteristics or changes in the
reader configuration, such as illumination or optical
focus.
7.4.2
Within the grayscale image, ba sed upon the
matrix coordinates and the number of rows and
columns in the matrix, determine a scanline of pixels
which bisects the horizontal alternating pattern and
determine a scanline which bisects the vertical
alternating pattern of the matrix (Figure 3). Scan along
each alternating pattern, generating a cross-sectional
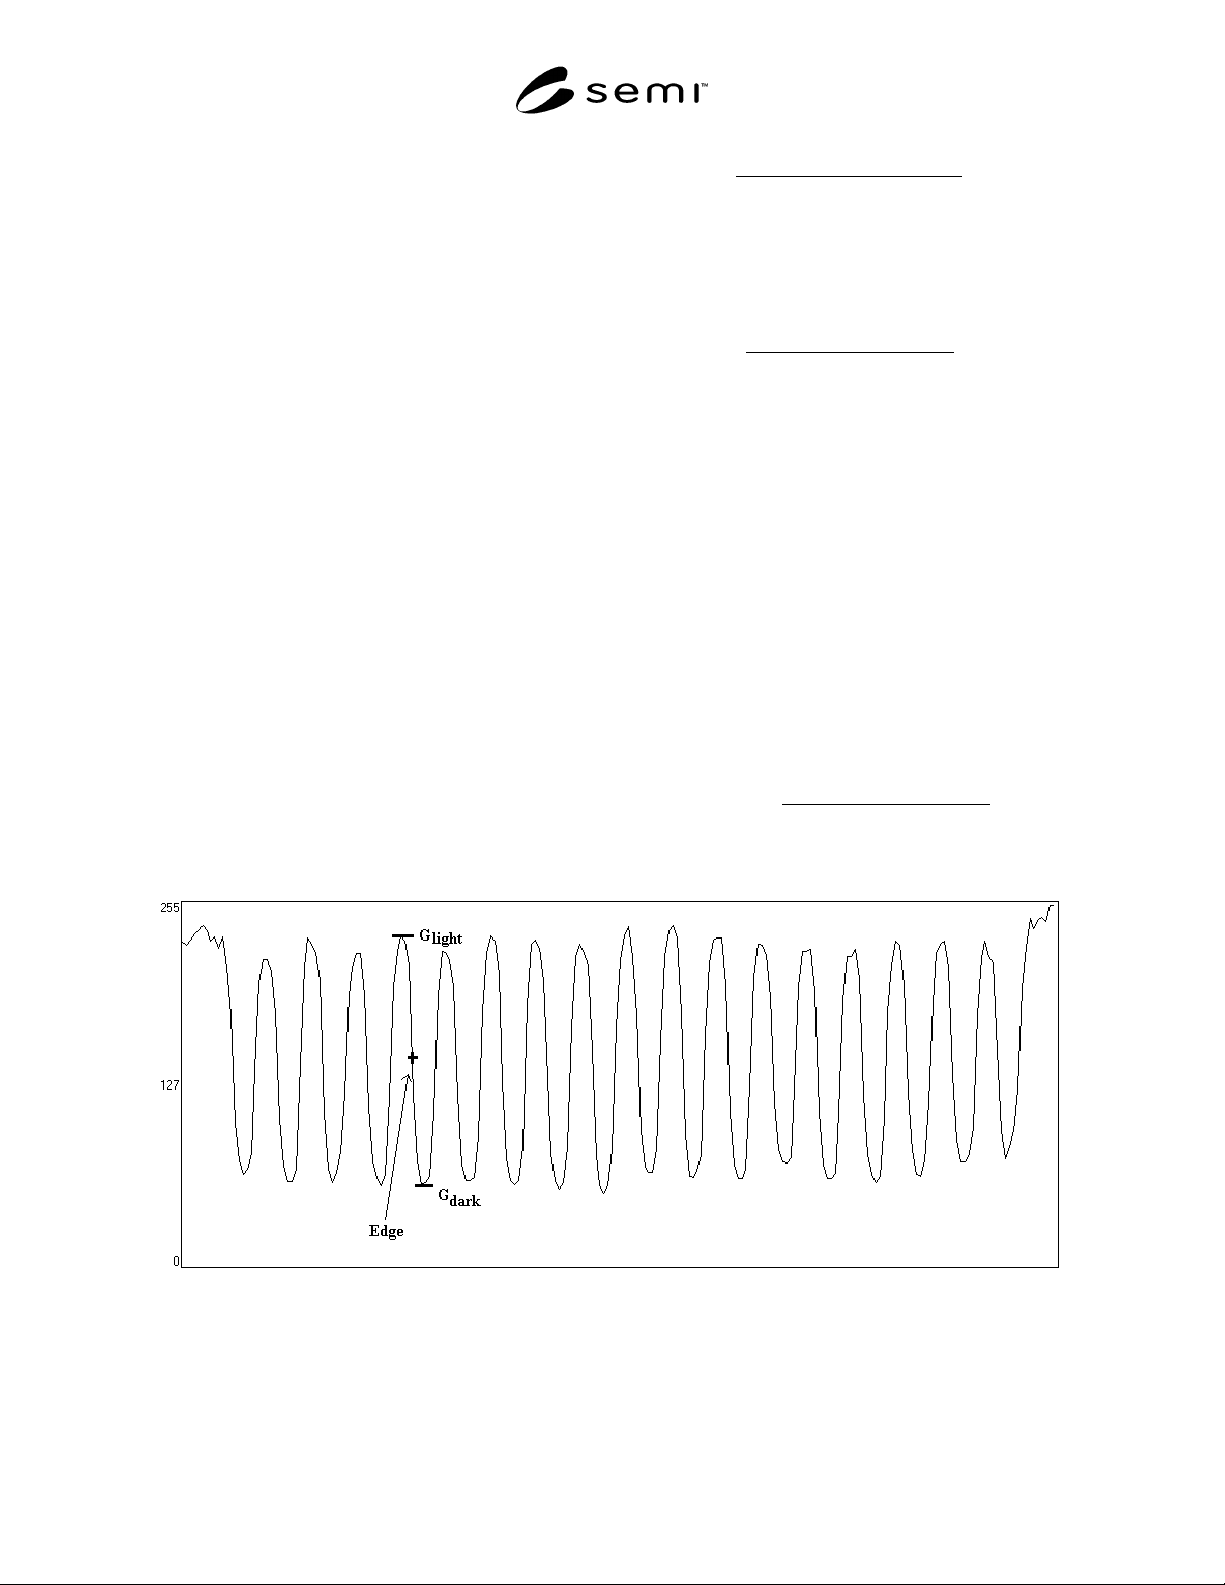
grayscale profile of each alternating pattern as shown in
Figure 5. Determine the location of each edge within
the alternating patterns locally, using an appropriate
edge detection method. Based upon the edge locations,
compute the width of each matrix cell in the horizontal
alternating pattern in the direction of the horizontal
scanline. Also, compute the height of each matrix cell
in the vertical alternating pattern in the direction of the
vertical scanline. Separate the mark and space cell
widths and compute the median space cell width (SCW)
and the median mark cell width (MCW). Horizontal
Mark Growth (HMG) is computed as:
100%
(SCW) Med(MCW) Med
MCW) ( Med
HMG ×
+
= (3)
Separate the mark and space cell heights and compute
the median space cell height (SCH) and the median
mark cell height (MCH). Vertical Mark Growth
(VMG) is computed as:
100%
Med(SCH)Med(MCH)
Med(MCH)
VMG ×
+
= (4)
Report the Horizontal Mark Growth and Vertical Mark
Growth values.
7.5 Data Matrix Cell Size
7.5.1 The Data Matrix Cell Size expresses the average
size of each cell in the matrix in pixels and is composed
of a width and height component. Compute the Cell
Size using the distances between corner points and the
known number of rows M and the known number of
columns N in the matrix (referring to Figure 3).
7.5.2
Data Matrix Cell Width
7.5.2.1 Compute the Data Matrix Cell Width
(DMCW) using the distance between P1 and P4,
dist(P1, P4), the distance between P2 and P3, dist(P2,
P3) and the number of columns N as follows:
N2
P3)(P2,dist P4)(P1,dist
DMCW
×
+
=
(5)
Report the Data Matrix Cell Width.
Figure 5
Mark Growth Cross-Sectional Grayscale Profile

SEMI T10-0701 © SEMI 20017
7.5.3 Data Matrix Cell Height
7.5.3.1 Compute the Data Matrix Cell Height
(DMCH) using the distance between P1 and P2,
dist(P1,P2), the distance between P3 and P4,
dist(P3,P4) and the number of rows M as follows:
M2
P4)dist(P3,P2)dist(P1,
DMCH
×
+
=
(6)
Report the Data Matrix Cell Height.
7.6 Data Matrix Mark Misplaceme nt
7.6.1 Data Matrix Mark Misplacement measures the
average misplacement of Data Matrix marks from their
respective ideal Data Matrix Cell Center Points as
defined in Section 7.1.3. The Mark Misplacement is
measured separately in horizontal and vertical
directions relative to the average width of the marks in
the respective direction.
7.6.2
Using the mark cell horizontal and vertical edge
locations, as determined in Section 7.4.2, compute the
image coordinate of the midpoint between the edges of
each mark in the corresponding horizontal and vertical
directions. In the horizontal direction, for each mark
calculate its misplacement MH
i
as the distance between
the detected midpoint and its ideal cell center point. In
the vertical direction, for each mark calculate its
misplacement MV
i
as the distance between the detected
midpoint and its ideal cell center point.
7.6.3
Horizontal Mark Misplacemen t
7.6.3.1 In the horizontal direction, for a given number
of columns N, and the Data Matrix Cell Width
(DMCW) as computed in Section 7.5.2, compute the
Horizontal Mark Misplacement (HMM)as follows:
100%
DMCWn
n
1i
i
MH
HMM ×
×
=
= (7)
where n = N/2 if N is even or n = N/2+1 if N is odd.
Report the Horizontal Mark Misplacement.
7.6.4
Vertical Mark Misplacement
7.6.4.1 In the vertical direction, for a g iven number of
rows M, and the Data Matrix Cell Height (DMCH) as
computed in Section 7.5.3, compute the Vertical Mark
Misplacement (VMM) as follows:
100%
DMCHm
m
1i
i
MV
VMM ×
×
=
= (8)
where m = M/2 if M is even and m = M/2+1 if M is
odd. Report the Vertical Mark Misplacement.
7.7 Unused Error Correction
7.7.1 The error correction capacity of Reed-Solomon
decoding is expressed in the equation:
pdte −≤+ 2
where: (9)
e is the number of erasures,
t is the number of errors,
d is the number of error correction codewords,
p is the number of codewords reserved for
error detection.
7.7.2 Values for d and p are defined by the AIMI
Symbology Specification (often depending on symbol
size), while e and t are determined during a successful
decode. Compute the Unused Error Correction as
follows:
()
()
100%
pd
2te
1.0UEC ×
−
+
−=
ö
ç
ç
è
æ
(10)
Report the Unused Error Correction value.
7.7.3
In symbols with more than one (e.g. interleaved)
Reed-Solomon block, calculate the Unused Error
Correction for each block independently and report the
value for each block.
7.8
Cell Defects and Finder Patter n Defects
7.8.1 If the error correction capacity of the Data
Matrix symbol is not exceeded then the Cell Defect
measurement can be made. Because the Data Matrix
symbol has been decoded, the correct binary value of
each cell is known.
7.8.2
Based upon the Data Matrix Grid as defined in
Section 7.1.2 (Figure 4), and the total matrix size,
identify the number and location of all pixels which fall
within the bounds of the Data Matrix Grid. Based upon
the reflectance threshold determined by the Symbol
Contrast measurement, assign a binary value to each
pixel within the Data Matrix Grid. Accumulate the
total number of identified image pixels, which are the
incorrect binary value. Divide this number by the total
number of pixels within the Data Matrix Grid.
100%
pixelsof#total
pixelsincorrectof#
DefectsCell ×= (11)
7.8.3 Finder pattern quality can be c alculated in a
similar manner. Based on the Data Matrix Grid as
defined in Section 7.1.2 (Figure 4), determine the
number and location of image pixels which fall within
the bounds of the L finder pattern of the Data Matrix
Grid. Using the reflectance threshold determined by
the Symbol Contrast measurement, assign a binary
value to each pixel within the L finder pattern.
Accumulate the total number of identified image pixels,