semi合集-English.pdf - 第862页
SEMI E115-0302 E © SEMI 2002 8 0.0 2.0 4.0 6.0 8.0 10.0 024 68 1 0 Real Load Impedance (ohms) Load Position (volts) Tune Position Fixed at 5.0 Volts NOTE 1: For this example, the full-scale vol tage for both the Tu ne an…
SEMI E115-0302
E
© SEMI 2002 7
RF out R
AB
Port 2Port 1
Port 1
Port 2
Perform Calibrations
at End of Additional
Test Cables
RLOSS
LC2
C1
Load Simulator
Input Connection
Output Connection
Matching Network
Network
Analyzer
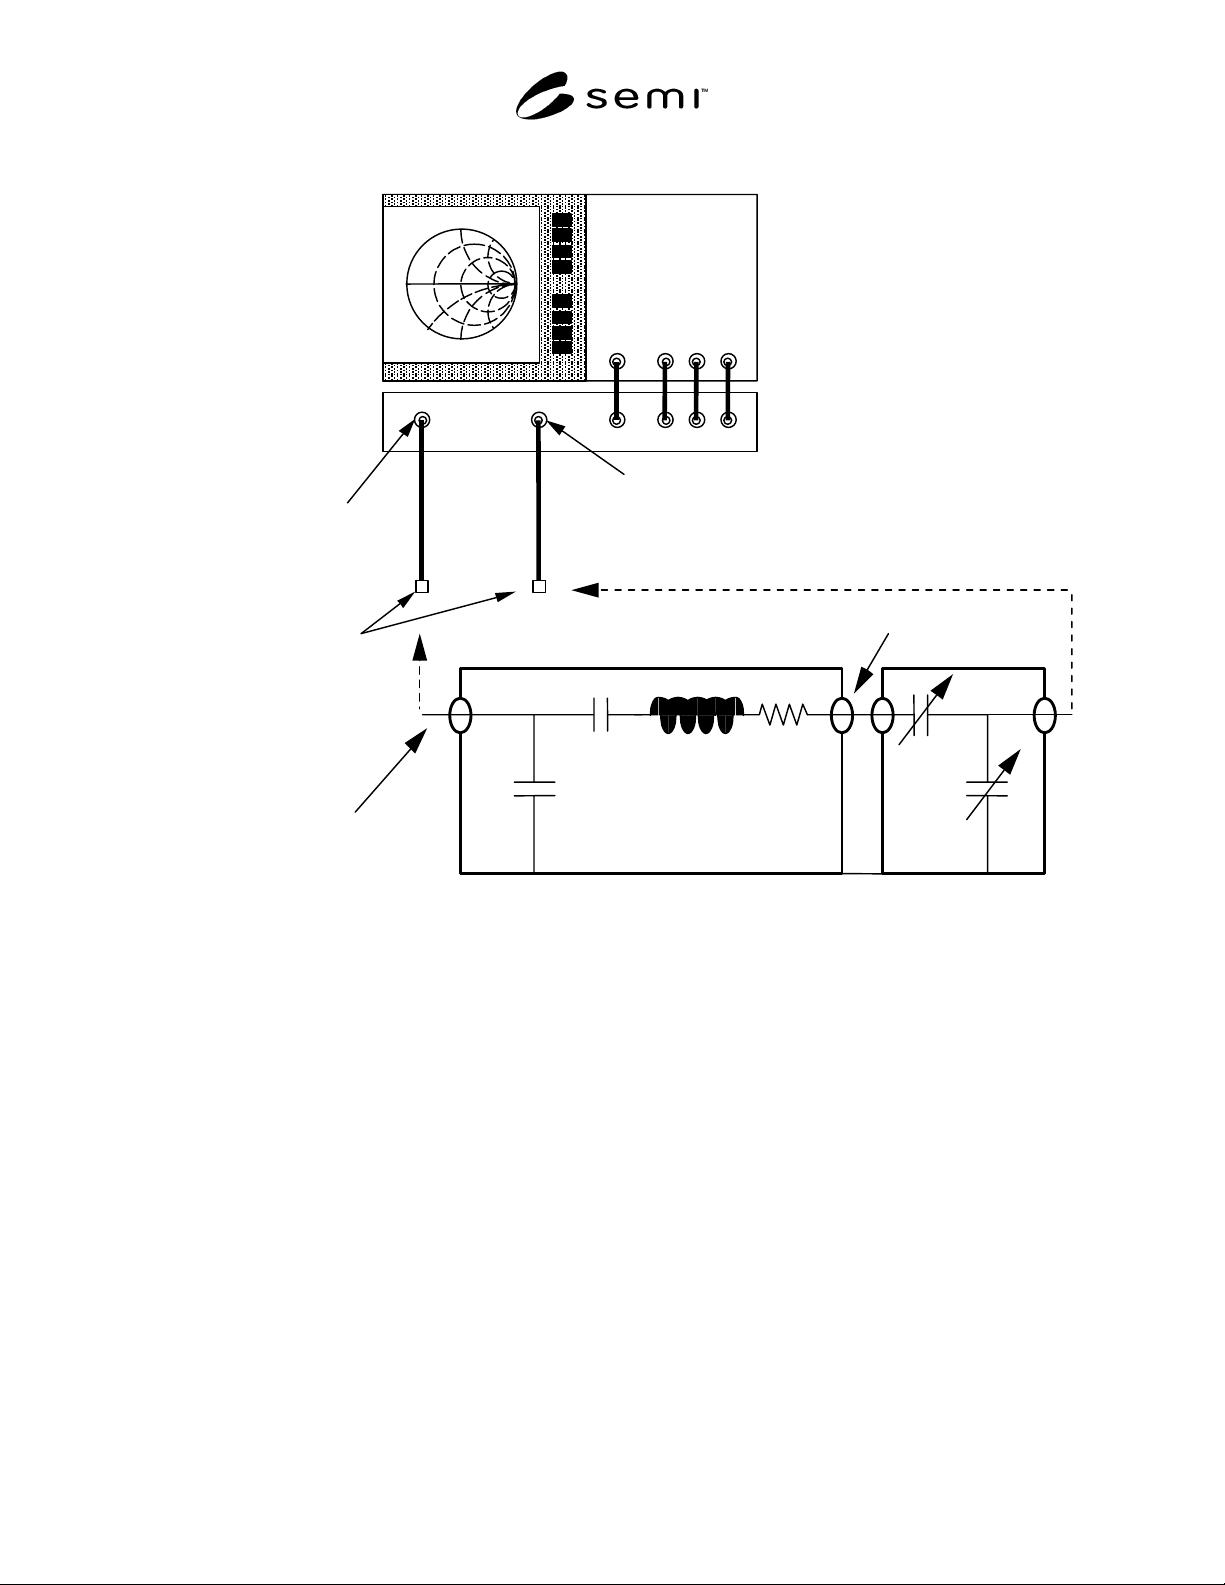
NOTE 1: Both the Port 1 and Port 2 outputs need to be used for the measurement and additional test cables are needed for the
transmission calibration between the two ports. The input connection of the matching network to be tested (DUT) attaches to
Port 1, the output connection of the matching network attaches to the input of the Load Simulator, and the output of the Load
Simulator attaches to Port 2 of the Network Analyzer.
Figure 2
Schematic of the Test Method 2 Network Analyzer Test Setup for the Load Impedance and Efficiency
Measurement
SEMI E115-0302
E
© SEMI 2002 8
0.0
2.0
4.0
6.0
8.0
10.0
0246810
Real Load Impedance (ohms)
Load Position (volts)
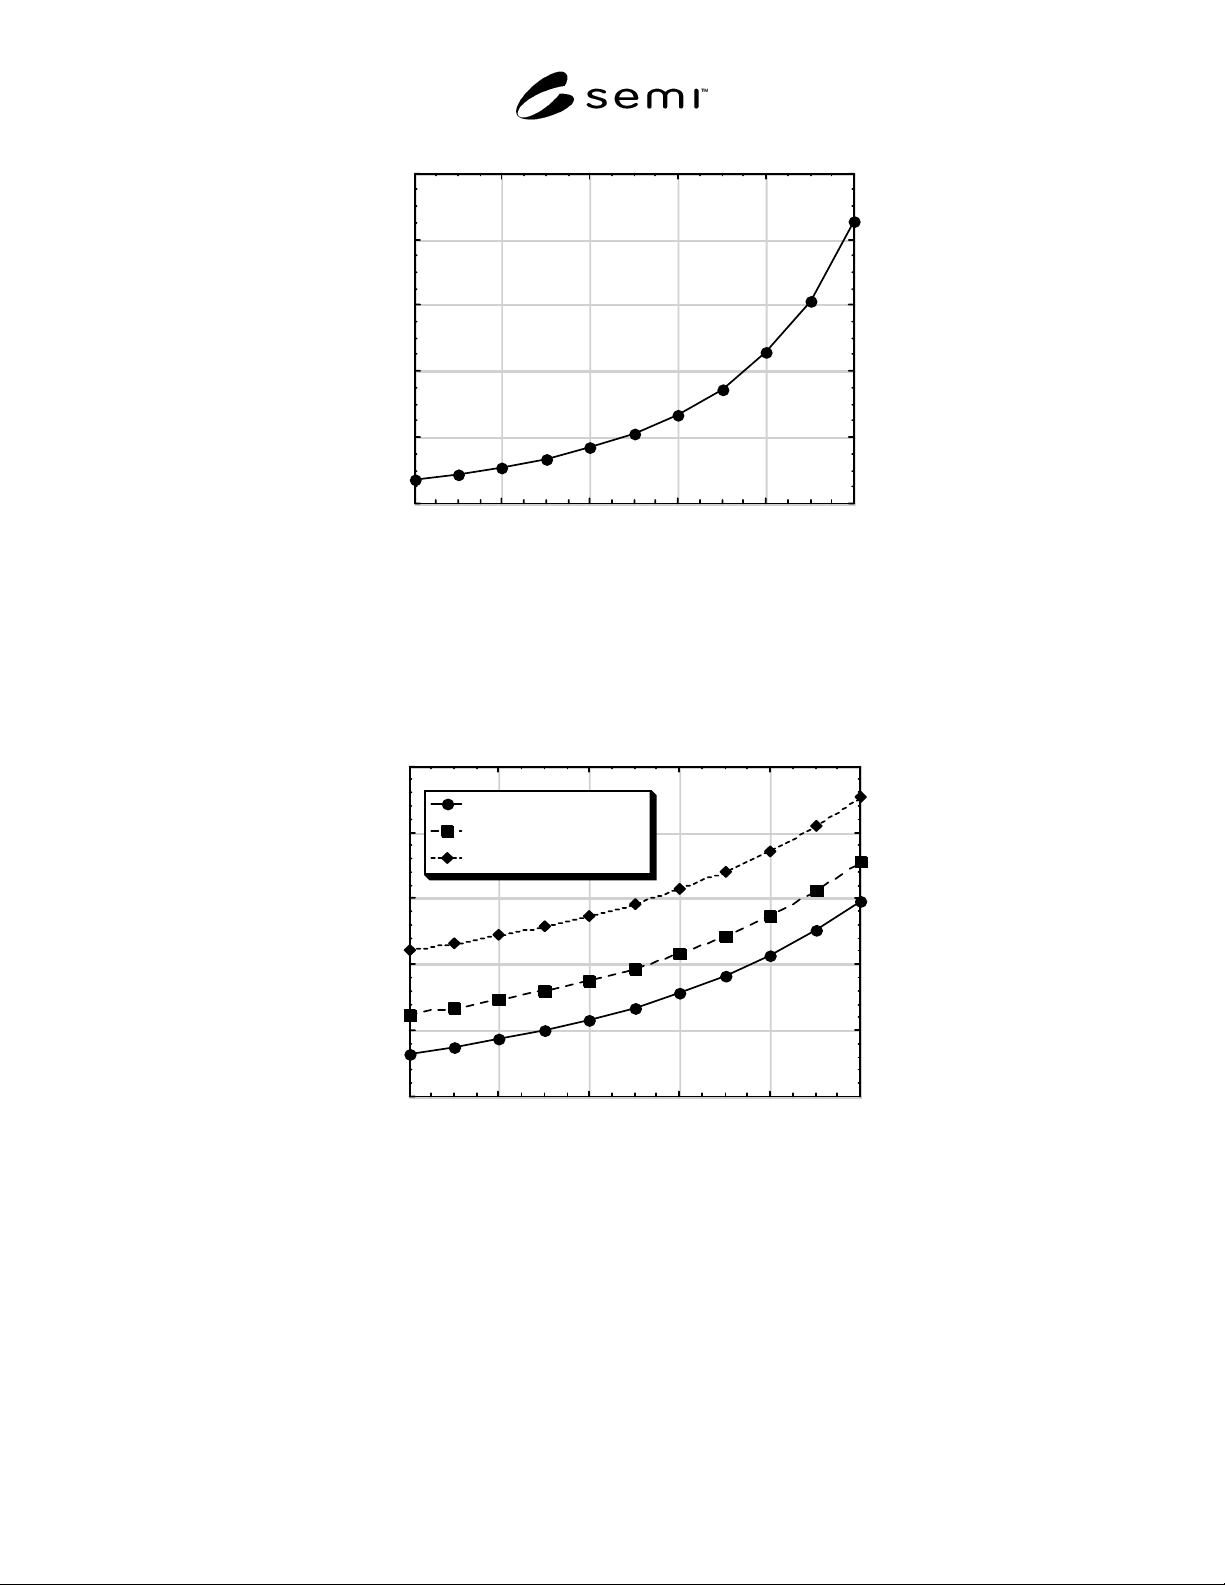
Tune Position Fixed at 5.0 Volts
NOTE 1: For this example, the full-scale voltage for both the Tune and Load Positions is 10 V (i.e., Tune = 5.0 V corresponds to
50% of full scale).
Figure 3
Example Plot of the Real Part of the Load Impedance as a Function of the Load Position Tuning Element in
the Matching Network
-35.0
-30.0
-25.0
-20.0
-15.0
-10.0
0246810
Tune = 3.0 volts
Tune = 5.0 volts
Tune = 7.0 volts
Reactive Load Impedance (ohms)
Load Position (volts)
NOTE 1: The Tune Position is at the indicated fixed value for each set of data. For this example, the full scale voltage for both
the Tune and Load Positions is 10 V (i.e., Tune = 3.0 V corresponds to 30% of full scale).
Figure 4
Example Plot of the Reactive Part of the Load Impedance as a Function of the Load Position Tuning Element
in the Matching Network
SEMI E115-0302
E
© SEMI 2002 9
50.0
60.0
70.0
80.0
90.0
100.0
0246810
Tune = 3.0 volts
Tune = 5.0 volts
Tune = 7.0 volts
Power Efficiency (%)
Load Position (volts)
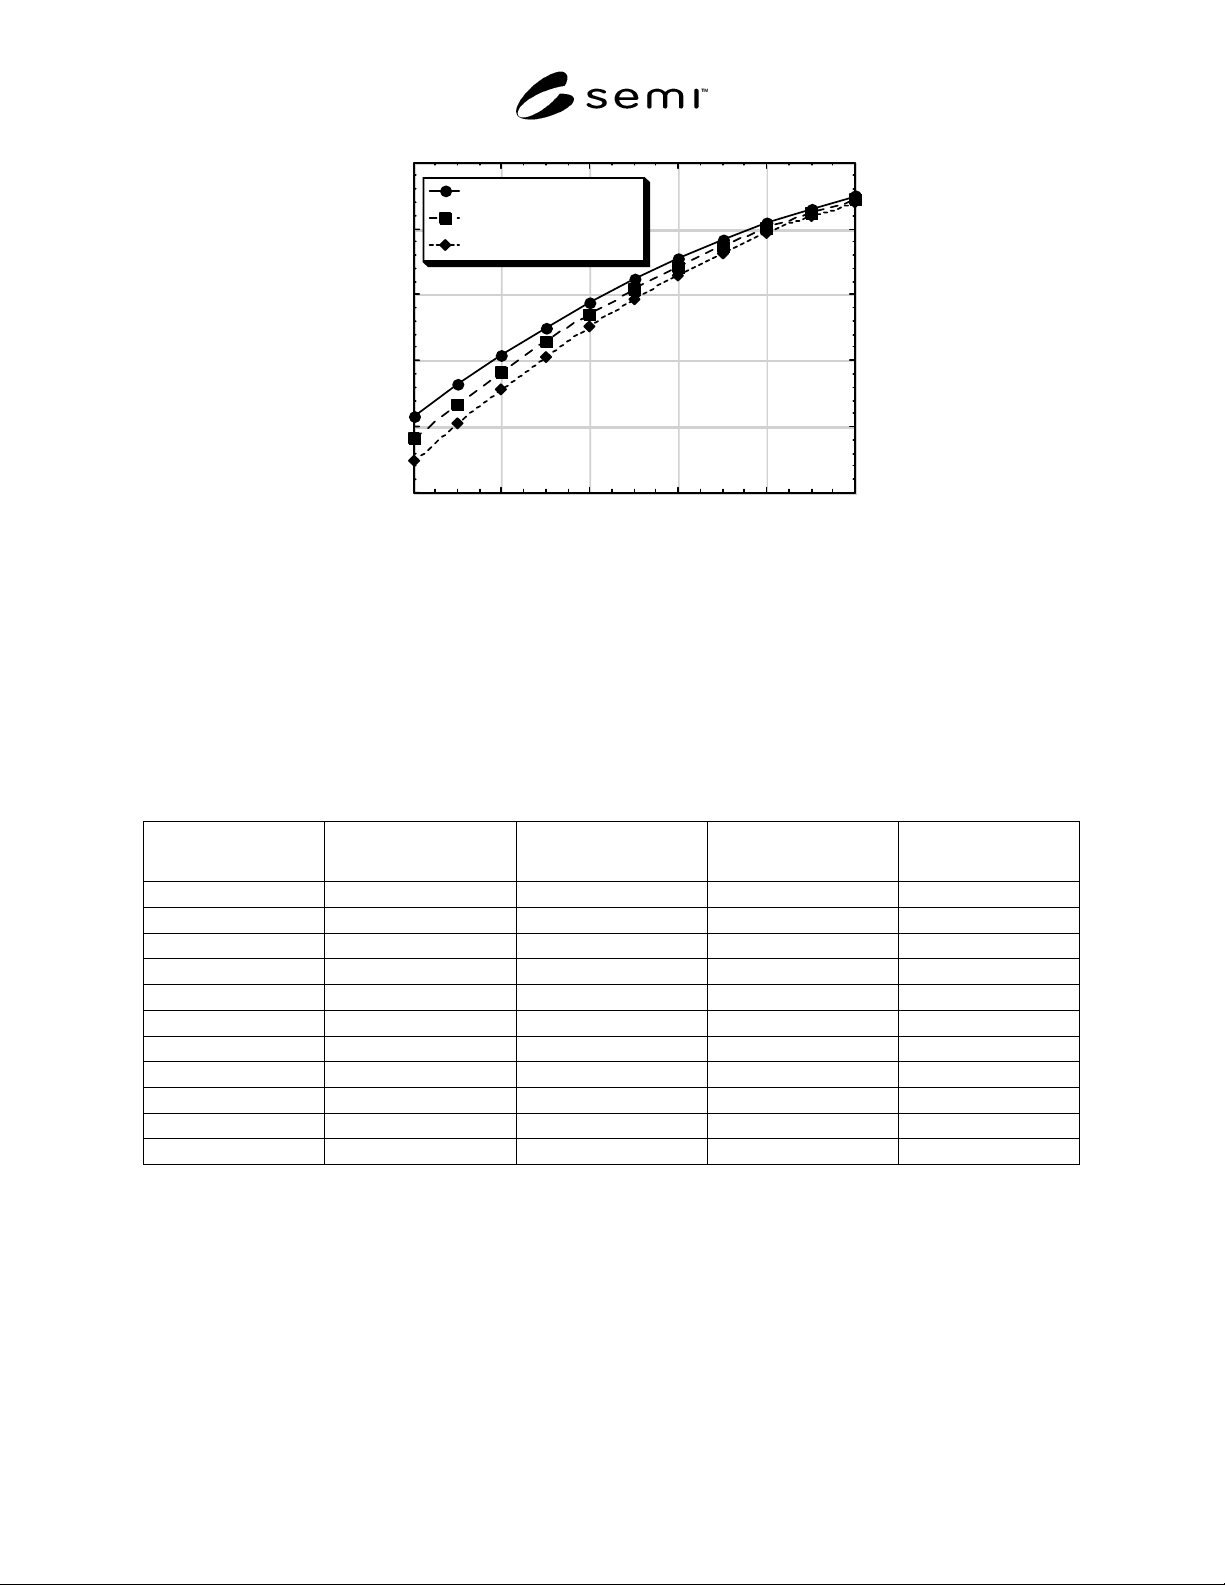
NOTE 1: The Tune Position is at the indicated fixed value for each set of data. For this example, the full scale voltage for both
the Tune and Load Positions is 10 V (i.e., Tune = 3.0 V corresponds to 30% of full scale).
Figure 5
Example Plot of the Power Efficiency as a Function of the Load Position Tuning Element in the Matching
Network
Table 1 Example Data Table Showing the Matching Network Load Impedance and Power Efficiency as a
Function of the Positions of the Tuning Elements
Load
Position (Volts)
Tune
Position (Volts)
Real Load
(ohms)
Reactive Load
(ohms)
Efficiency (%)
0 3 0.74 -31.75 61.51
1 3 0.91 -31.23 66.36
2 3 1.12 -30.64 70.86
3 3 1.38 -29.96 75.04
4 3 1.72 -29.18 78.88
5 3 2.15 -28.26 82.38
6 3 2.72 -27.17 85.56
7 3 3.50 -25.87 88.39
8 3 4.59 -24.31 90.90
9 3 6.18 -22.42 93.07
10 3 8.57 -20.15 94.91
NOTE 1: For this example, the full-scale voltage for both the Tune and Load Positions is 10 V (i.e., Tune = 3.0 V corresponds to 30% of full
scale). This example only shows data for a fixed Tune position of 3.0 volts. Data is also required at a Tune position of 0.0 V, 1.0 V, etc.