semi合集-English.pdf - 第866页
SEMI E115-0302 E © SEMI 2002 12 Series Capacitor Strap Input Rotating Shafts Shunt Capacitor Output NOTE 1: Picture of a Load Simulator showing the variable capacitors. The capacitors are connected toge ther by a strap t…
SEMI E115-0302
E
© SEMI 2002 11
impedance, the magnitude of the reflection coefficient
(S11), and the magnitude of the transmission coefficient
(S21) shall be recorded. In addition, the positions of
the tuning elements of the Load Simulator shall be
recorded.
R1-3.5 The efficiency of the Load Simulator is
determined from both the reflection and transmission
coefficients. The efficiency can be calculated by taking
the ratio of the output power divided by the input
power. The output power is simply (S21)
2
and the
input power is (1-(S11)
2
).
()
()
2
2
111
21
S
S
iencyator EfficLoad Simul
−
=
Typically, the reflection and transmission coefficients
are expressed in terms of dB (decibels). The conversion
between dB and efficiency is expressed as
)10/dBin 11S(
)10/dBin 21S(
101
10
−
=EfficiencySimulator Load
)10/dBin 11S(
)10/dBin 21S(
101
10
100%
−
×=TransferPower
For example, if the transmission coefficient is measured
to be –10 dB and the reflection coefficient is measured
to be –0.5 dB, then the power transfer efficiency would
be 91.95%. In other words, 8.05% of the power is lost
in the Load Simulator.
R1-3.6 For the next measurement, one tuning element
shall remain fixed (C2), and the other tuning element
(C1) shall be increased by an increment equal to no
more than 10% of the full scale range of the tuning
element position. After the tuning elements have been
moved to their new values, steps 3.4 and 3.5 shall be
repeated. This process shall be repeated until the tuning
element (C1) has covered its entire range.
R1-3.7 After the tuning element (C1) has been varied
over its entire range, the other tuning element (C2) shall
be increased by an increment equal to no more than
10% of its full-scale range. The C1 tuning element
shall then be moved back to its minimum position and
the above steps (R1.3.4–R1.3.6) shall be repeated until
the entire tuning range of the matching network is
measured.
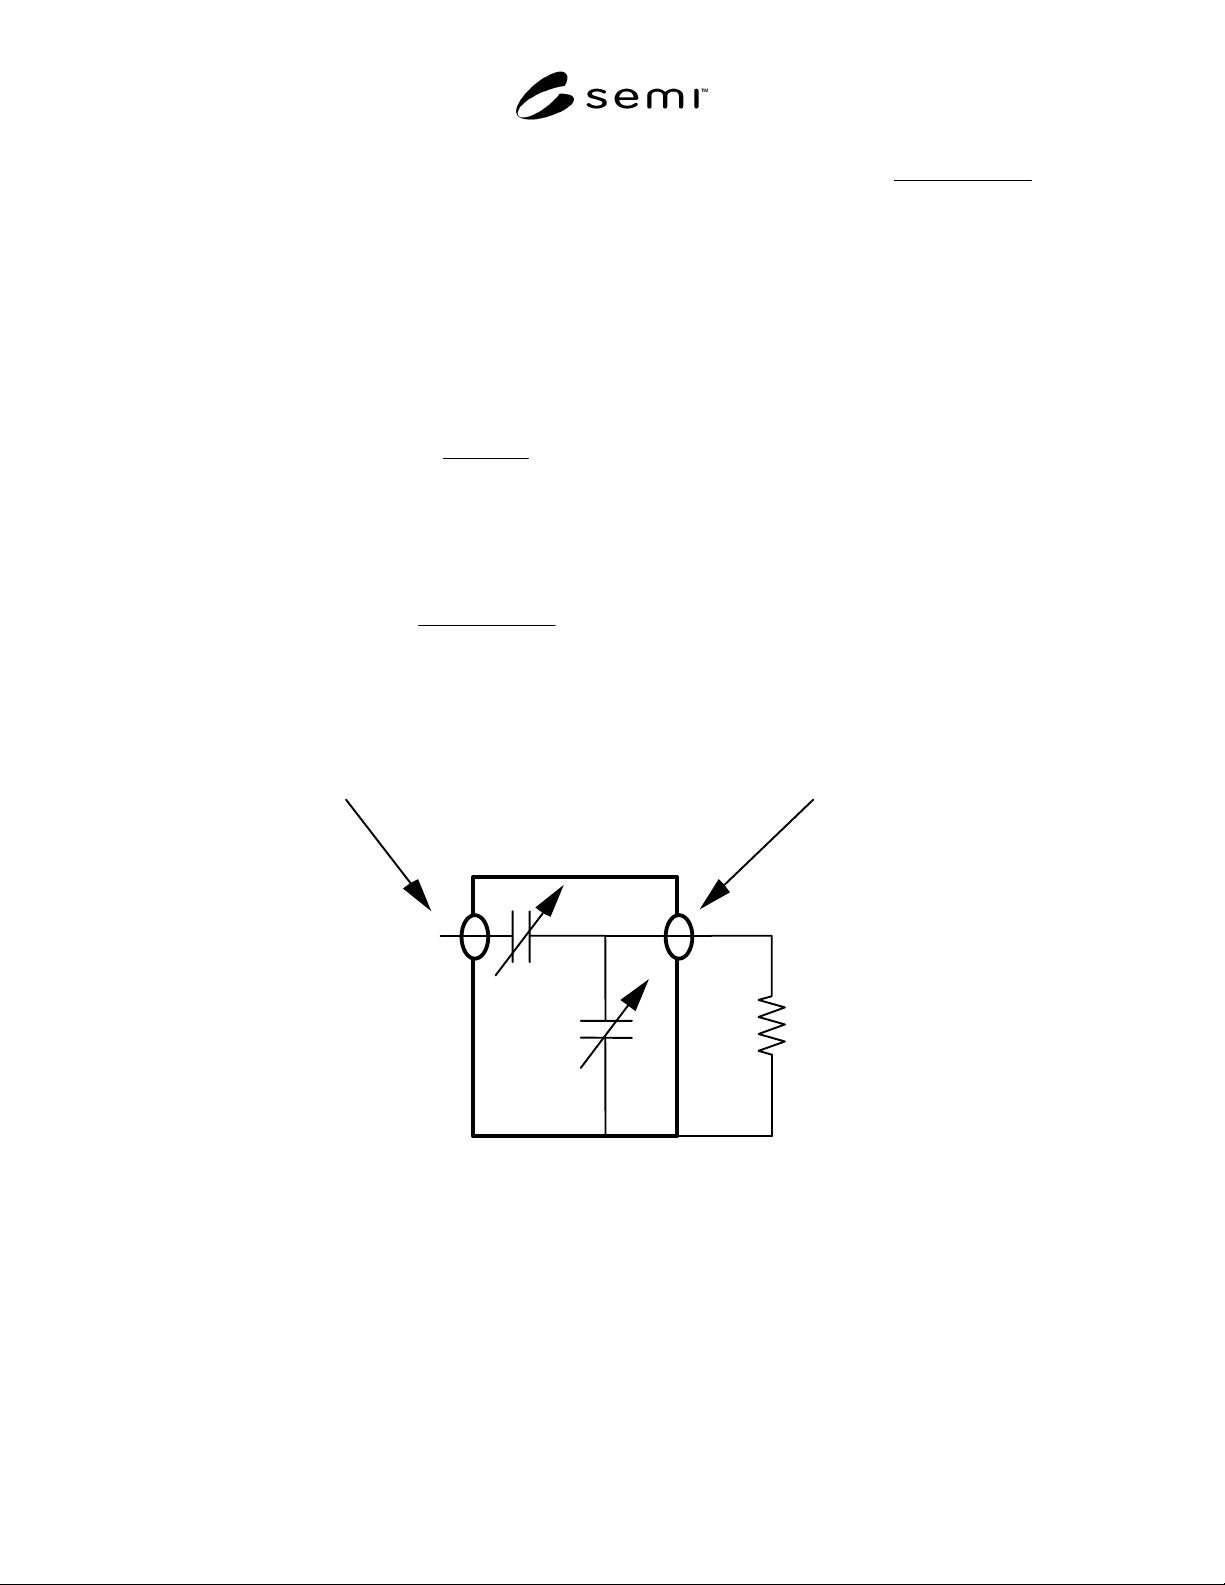
Load Simulator
Input Connection
Output Connection
C2
C1
50-Ohm Load
NOTE 1: The input connection is attached to a series variable capacitor, C2. The shunt variable capacitor, C1, is in parallel with
a 50-ohm load.
Figure R1-1
Schematic of a Load Simulator
SEMI E115-0302
E
© SEMI 2002 12
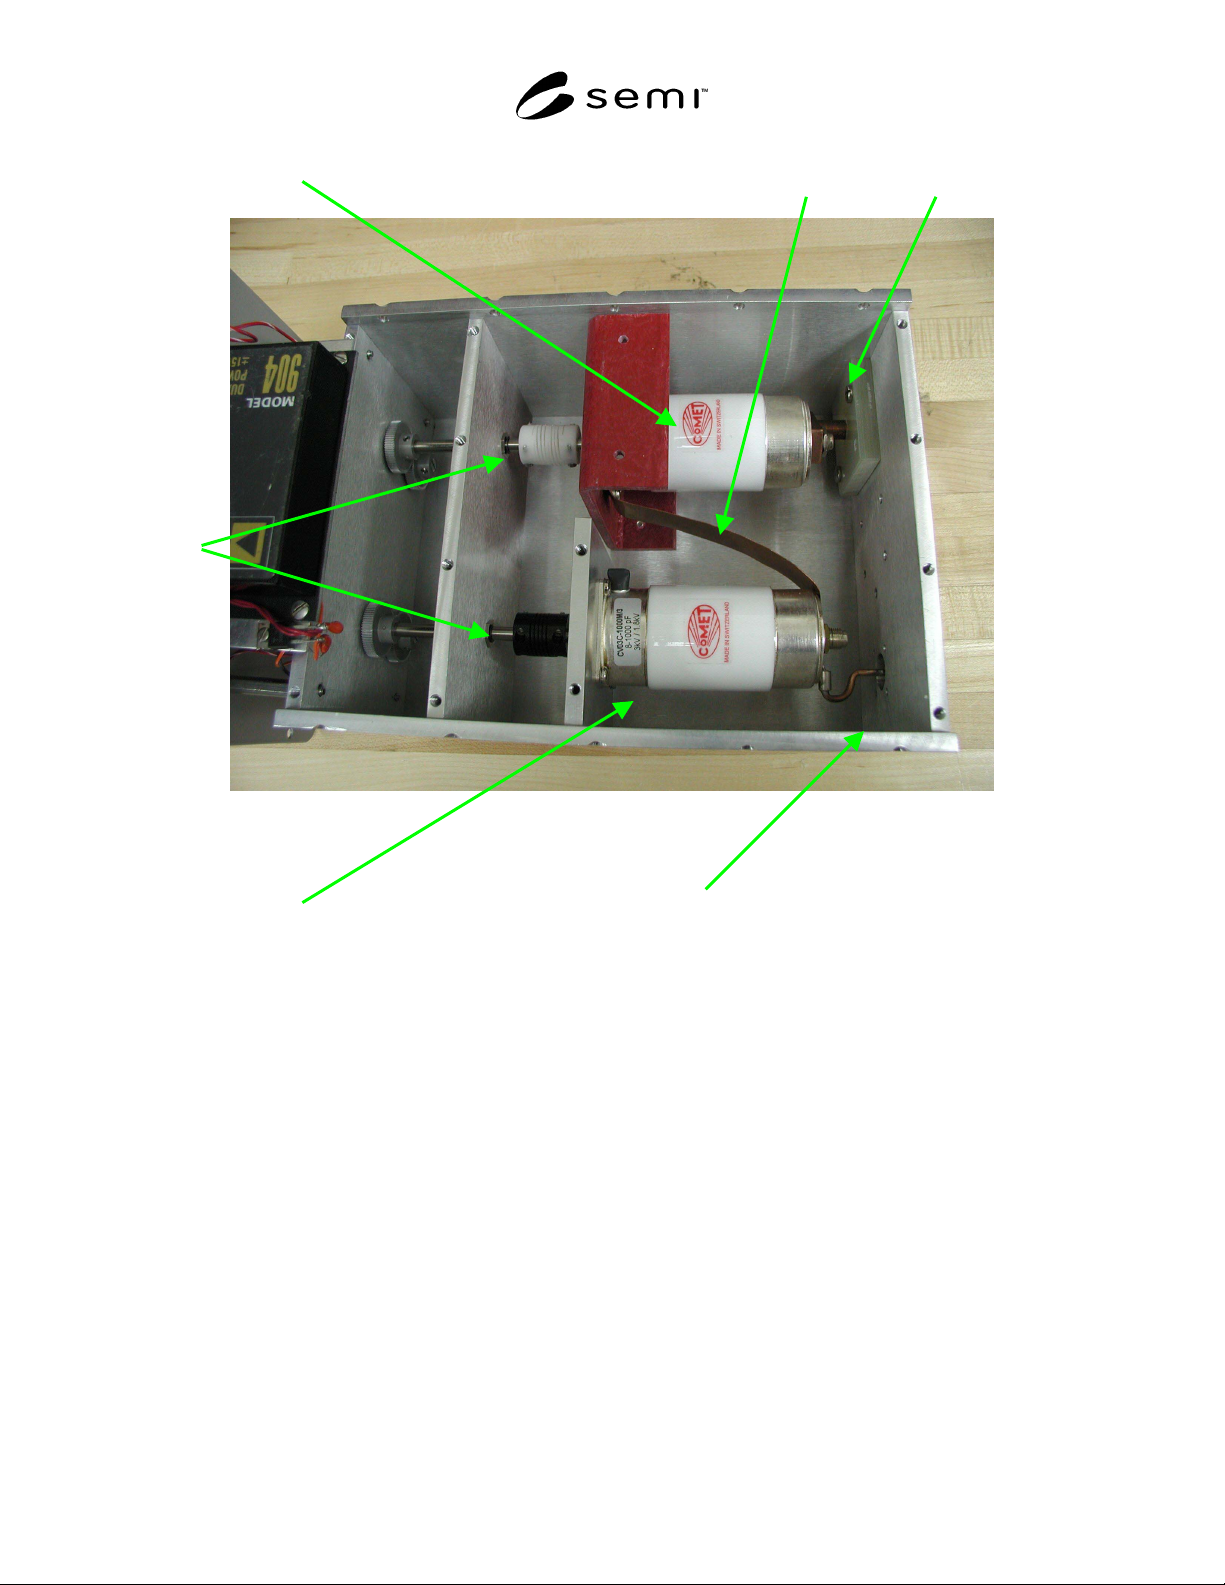
Series Capacitor Strap Input
Rotating
Shafts
Shunt Capacitor Output
NOTE 1: Picture of a Load Simulator showing the variable capacitors. The capacitors are connected together by a strap that has
an inductance of around 100 nH. The values of the capacitors are varied by rotating their shafts. The ends of the shafts are
connected to a dial indicator to measure their positions.
Figure R1-2
Picture of a Load Simulator Showing the Variable Capacitors
SEMI E115-0302
E
© SEMI 2002 13
0.0
10.0
20.0
30.0
40.0
50.0
0 500 1000 1500
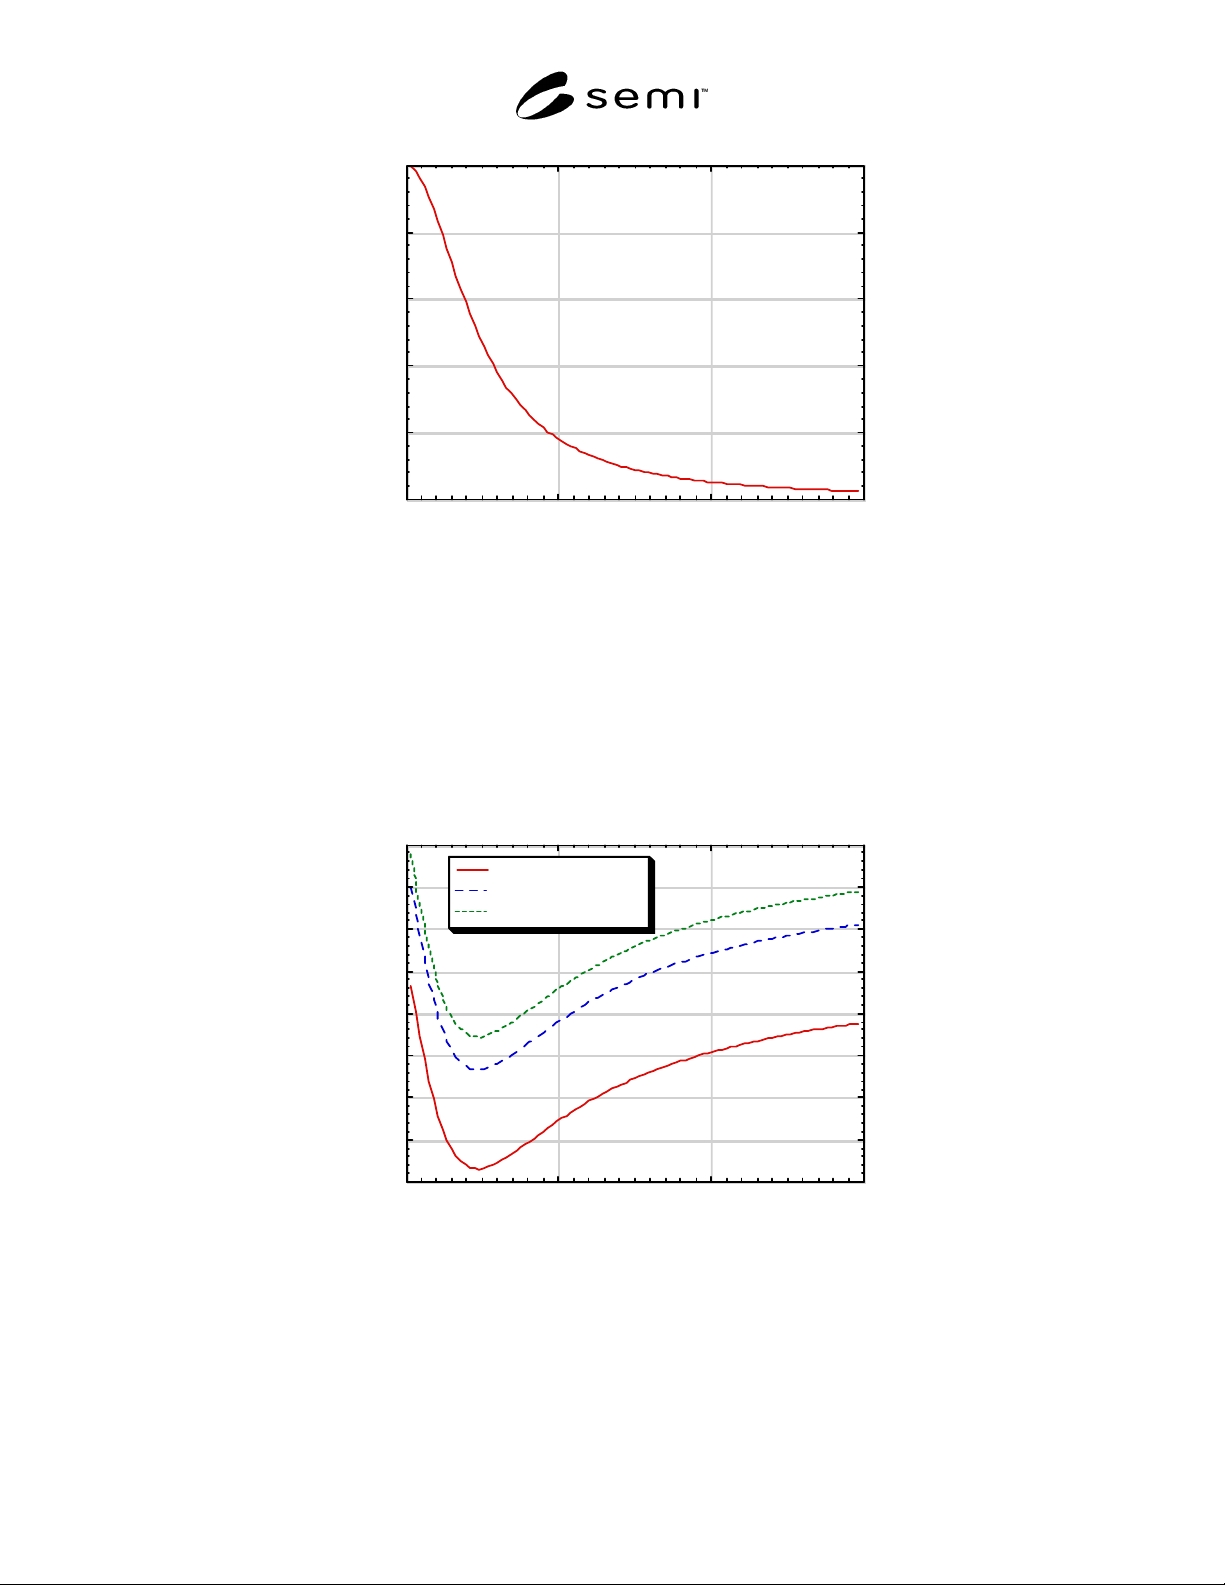
Real Impedance (ohms)
C1 Capacitance (pF)
NOTE 1: The real impedance varies from 1.2 ohms to close to 50 ohms.
Figure R1-3
Example Plot of the Real Part of the Load Impedance as a Function of the C1 Shunt Capacitor in the Load
Simulator
-40.0
-35.0
-30.0
-25.0
-20.0
-15.0
-10.0
-5.0
0.0
0 500 1000 1500
C2 = 500 pF
C2 = 1000 pF
C2 = 1500 pF
Reactive Impedance (ohms)
C1 Capacitance (pF)
NOTE 1: The C2 capacitance is at the indicated fixed value for each set of data. For this example, the reactive impedance varies
from around –40 ohms to –5 ohms. Decreasing C2 to 100 pF reduces the reactance to less than –100 ohms.
Figure R1-4
Example Plot of the Reactive Part of the Load Impedance as a Function of the C1 Shunt Capacitance in the
Load Simulator