MIL- STD-883F 2004 TEST METHOD STANDARD MICROCIRCUITS.pdf - 第103页
MIL-STD-883F METHOD 1016.1 18 June 2004 5 h. Requir ements f or data anal ysis , inc luding: (1) Fai lure analys is resul ts. (2) Data calcul ations : (a) Log nor mal by temperat ure. (b) Reac tion r ate relat ionshi ps …

MIL-STD-883F
METHOD 1016.1
18 June 2004
4
3.6 Test results analysis. Failure analysis of the accelerated test results is necessary to separate the failures into
temperature and nontemperature dependent categories. The nontemperature dependent failures should be removed from
the test data prior to life distribution analysis. All failures shall be reported together with the analysis results and rationale for
deletion of those identified as nontemperature dependent.
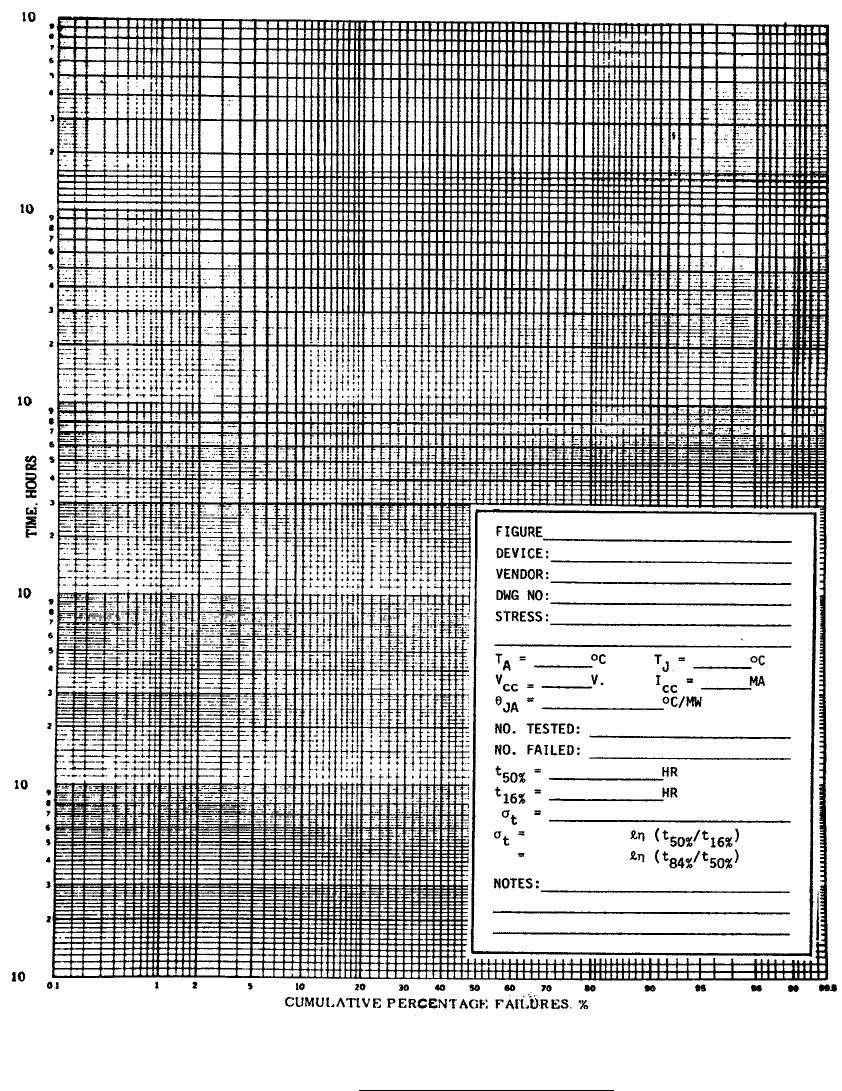
3.6.1 Life distribution analysis
. The effectiveness of the test result analysis can be enhanced by diligent failure analysis
of each test failure. Failures should be grouped by similarity of failure mechanisms, that is, surface related, metal migration,
intermetallic formation, etc. The time-to-failure history of each failure in a group should be recorded. This includes the
individual failure times and the associated calculated cumulative percent failures. To facilitate estimating the distribution
parameters from small-sample life tests, the data is plotted as a cumulative distribution. Since semiconductor life
distributions have been shown to follow a lognormal distribution, graph paper similar to figure 1016-1 is required for data
analysis. The lognormal distribution will appear as a straight line on this paper. The expected bimodal distribution of "freak"
and "main" populations in a combined form normally appears as an s-shaped plot. The distribution parameters necessary
for data analysis, median life and sigma (σ) can be calculated as:
σ
≈ ln
time of failure
time of failure
50%
16%
Separate analysis of the individual "freak" and "main" populations should be performed and "goodness of fit" tests applied to
test the apparent distribution(s).
3.6.2 Life acceleration analysis
. Life/reliability characterization requires the establishing of failure distributions for several
temperature stress levels at the same rated voltage condition. These failure distributions must represent a common failure
mechanism. Using a specially prepared graph paper for Arrhenius Reaction Rate Analysis as shown in figure 1016-2, the
median life times for the "freak" and "main" populations can be plotted to determine equivalent life-times at the desired use
temperatures.
3.6.3 Failure rate calculations
. Semiconductor failures are lognormally distributed. Therefore, the failure rate will vary
with time. Semiconductor failure rates at any given time can be calculated using figure 1016-3 which is a normalized
presentation of the mathematical calculations for the instantaneous failure rate from a lognormal distribution.
4. SUMMARY
. The following details shall be as specified in the applicable acquisition document:
a. Test temperature(s) and whether ambient or case.
b. Test mounting if other than normal (see 3).
c. Endpoint measurements (see 3.2).
d. Intermediate measurements (see 3.2).
e. Criteria for failure for endpoint and intermediate measurements (see 3.2), if other than device specification limits.
f. Test sample (see 3.3).
g. Requirements for inputs, outputs, biases, test circuit, and power dissipation, as applicable (see 3.4).
MIL-STD-883F
METHOD 1016.1
18 June 2004
5
h. Requirements for data analysis, including:
(1) Failure analysis results.
(2) Data calculations:
(a) Log normal by temperature.
(b) Reaction rate relationships
(c) Failure rate versus time.
MIL-STD-883F
METHOD 1016.1
18 June 2004
6
FIGURE 1016-1. Cumulative failure distribution plot
.