MIL- STD-883F 2004 TEST METHOD STANDARD MICROCIRCUITS.pdf - 第380页
MIL-STD-883F METHOD 2023.5 19 August 1994 8 APPENDIX A Capabilit y Study Example The worst case di e/pack age combinat ion for the example produc t line i s a 100 wir e package wi th the s malles t die. The worst case di…
MIL-STD-883F
METHOD 2023.5
19 August 1994
7
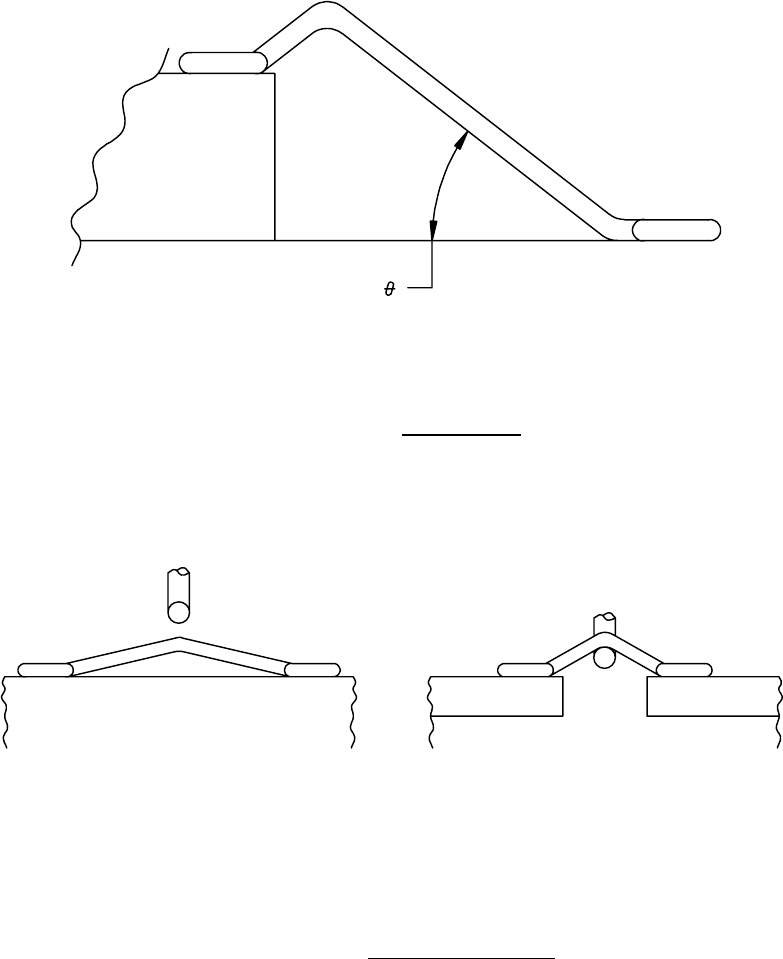
FIGURE 2023-1. Wire loop angle
.
FIGURE 2023-2. Flat loop wire pull testing
.

MIL-STD-883F
METHOD 2023.5
19 August 1994
8
APPENDIX A
Capability Study Example
The worst case die/package combination for the example product line is a 100 wire package with the smallest die. The
worst case die/package combination is based on the characterized worst case wire geometry and number of bonding wires.
A post seal bond pull of 2 grams or less is considered unacceptable for 1.25 mil diameter aluminum wire. The proposed
military standard requires a failure rate of no greater than 100 parts per million.
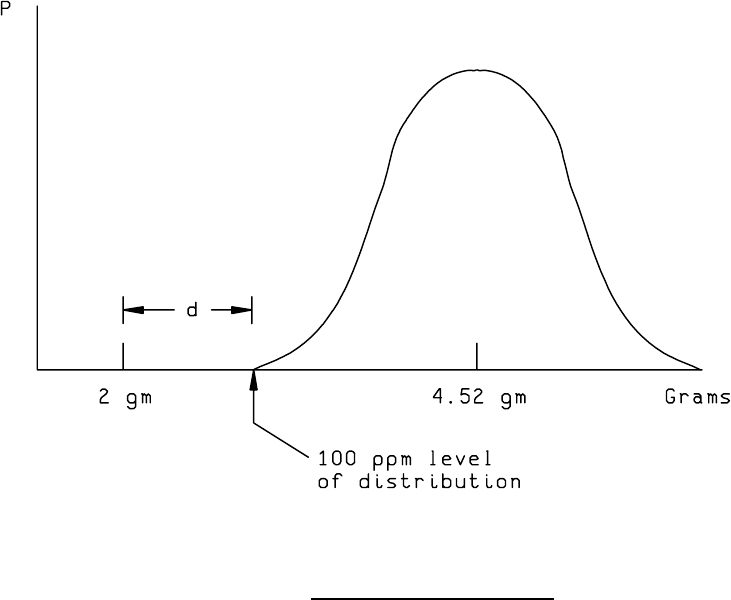
The distribution of bond pulls across devices is examined for each wire length. A statistical test is done for normality and
in this example there is no reason to reject the assumption of normality. The worst case wire length in terms of variability
and closeness to the specification of 2 grams is identified. The mean of this worst case distribution is found to be 4.26
grams with a standard deviation of .5 grams.
Thus, for this distribution the 2 gram specification is 4.52 standard deviations away [(4.26-2)/(.5)] and corresponds to a
ppm level of approximately 3.1. If the distribution was to shift to the 100 ppm level such that 2 grams corresponds to 100
ppm (i.e., the 2 gram spec is now only 3.719 standard deviations below the mean), a shift of about .8 sigma [4.52-3.719]
from the present bond pull mean of 4.26 would be required. This information is used to determine the number of devices
needed for the capability study.
The following table can be used where the data is normally distributed:
Sigma shift to 100 ppm level
Devices needed
.4 140
.5 90
.6 62
.7 46
.8 35
.9 28
1.0 22
1.1 19
1.2 16
1.3 13
1.4 11
1.5 or greater 10
n = [(Z_alpha + Z_beta)**2]/(d**2)
d = standard deviation shift = 0.8
alpha = .05 ; Z_alpha = -1.645
beta = .001 ; Z_beta = -3.09
[see Diamond, 1989, Practical Experiment Designs, pages 45-47]
Therefore, n = [(1.645 + 3.09)**2]/(.8)**2 = 22.42/.64 = 35. Thirty five devices are used in this capability study.
Using the standard bonding process, the 35 devices (each having 100 wires) are submitted to package seal, and
post-seal bond strength measured.
For each wire position a mean and standard deviation is calculated across the 35 devices.
mean = xbar
standard deviation = sd
The distributions are evaluated and show no significant departure from normality.
The lower spec limit is determined: Here a lower bond pull of 2 grams.
MIL-STD-883F
METHOD 2023.5
19 August 1994
9
For each wire position a "Z" is calculated:
Z = (xbar - LSL) / sd
For each wire position a probability of wire failure is determined by finding the probability of being below the Z value. Use
of normal probability tables are utilized in this example because of the distributions being normally distributed. For this
example there will be 100 values.
The probability of device failure is calculated by summing the 100 p values for failure of a wire position.
P(Device Failure) = Summation of P(failure of wire position)
= .00005 for this example or 50 parts per million
For this example it has been demonstrated that the probability of any device failing the minimum post-seal bond strength
is less than .0001.
FIGURE 2023-3. Bond strength versus probability
.