MIL- STD-883F 2004 TEST METHOD STANDARD MICROCIRCUITS.pdf - 第703页
MIL-STD-883F METHOD 5012.1 27 July 199 0 9 FIGURE 1. Node c onsis ting of fan-in br anches, a fan-out origi n, and fan-o ut br anches . TABLE I. Penal ty values , P, f or LFSR signat ure anal yzers implement ing pri miti…

MIL-STD-883F
METHOD 5012.1
27 July 1990
8
If fault simulation procedure 2 or 3 is performed for any G-logic partition, then the fault coverage for the logic model of a DUT
shall be reported as:
"No less than F of all detectable equivalence classes of single, permanent, stuck-at-zero and stuck-at-one faults on the
logic lines of the logic model, with 95 percent confidence, as measured by MIL-STD-883, test method 5012."
The confidence level of 95 percent shall be identified if any fault simulation procedure other than procedure 1 was performed
for any G-logic partition.
4. SUMMARY
. The following details shall be specified in the applicable acquisition document:
a. Minimum required level of fault coverage and method of obtaining fault coverage.
b. If a fault sampling method is permitted, guidance on selection of the random sample of faults.
c. Guidelines, restrictions, or requirements for test algorithms for B-Logic types.
d. The fault simulation report shall provide:
(1) Statement of the overall fault coverage. If there are undetectable faults due to three-state enable signal
lines, then, optionally, fault coverage based on those potential detections may be reported separately.
(2) Description of logic partitions.
(3) Description of test algorithms applied to B-logic. For each B-logic partition tested in this way the established
test algorithm, proof of its successful application, and description of its established fault coverage or test
effectiveness (including classes of faults detected) shall be documented.
(4) Justification for any initial condition, other than X, for any logic line or memory element.
(5) Justification for any approximations used, including estimates of fault coverages, transistor fractions, and
counts of undetectable faults.
(6) Description of any fault equivalencing procedure used in lieu of the procedure defined by table II.
(7) Justification for declaring any fault to be undetectable.
(8) In the event that the test vector sequence is formatted differently between the ATE and the fault simulator,
justification that fault coverage achieved on the ATE is not lower than the reported fault coverage.
(9) Justification of the use of fault simulation procedure 2 or 3 rather than fault simulation procedure 1.
(10) When fault sampling is used, description of the method of obtaining a random sample of faults.
(11) In the event that the fault simulation procedure used is not obviously equivalent to fault simulation procedure
1, 2, or 3, justification as to why it yields equivalent results.
(12) In the event that a test technique or design-for-testability approach is used that provides additional control or
observation test points beyond those provided by the DUT's primary inputs and primary outputs (see 1.1j),
justification that the stated fault coverage is valid.
*
*
*
*
*
*
*
*
*
*
*
*
*
MIL-STD-883F
METHOD 5012.1
27 July 1990
9
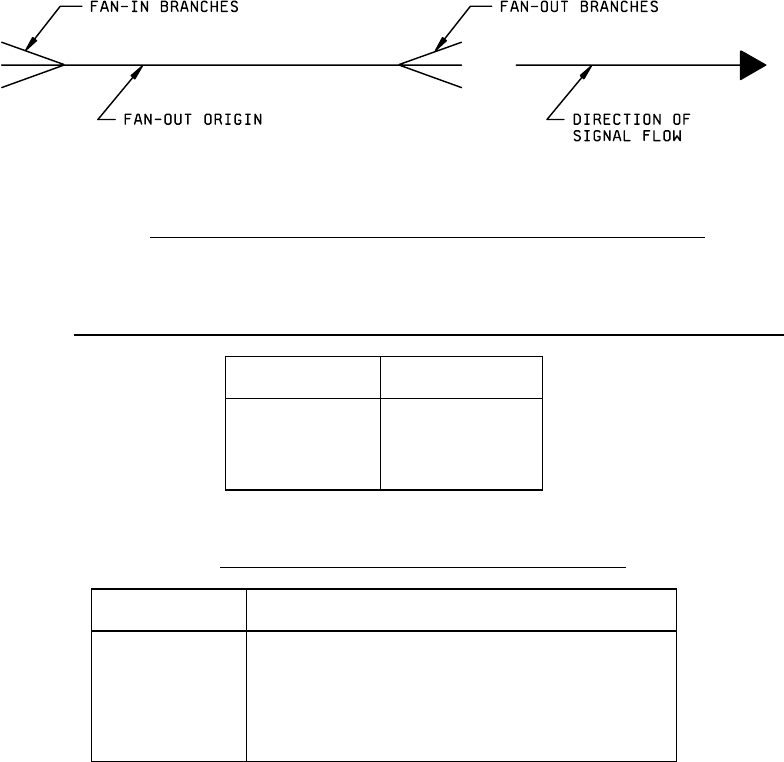
FIGURE 1. Node consisting of fan-in branches, a fan-out origin, and fan-out branches
.
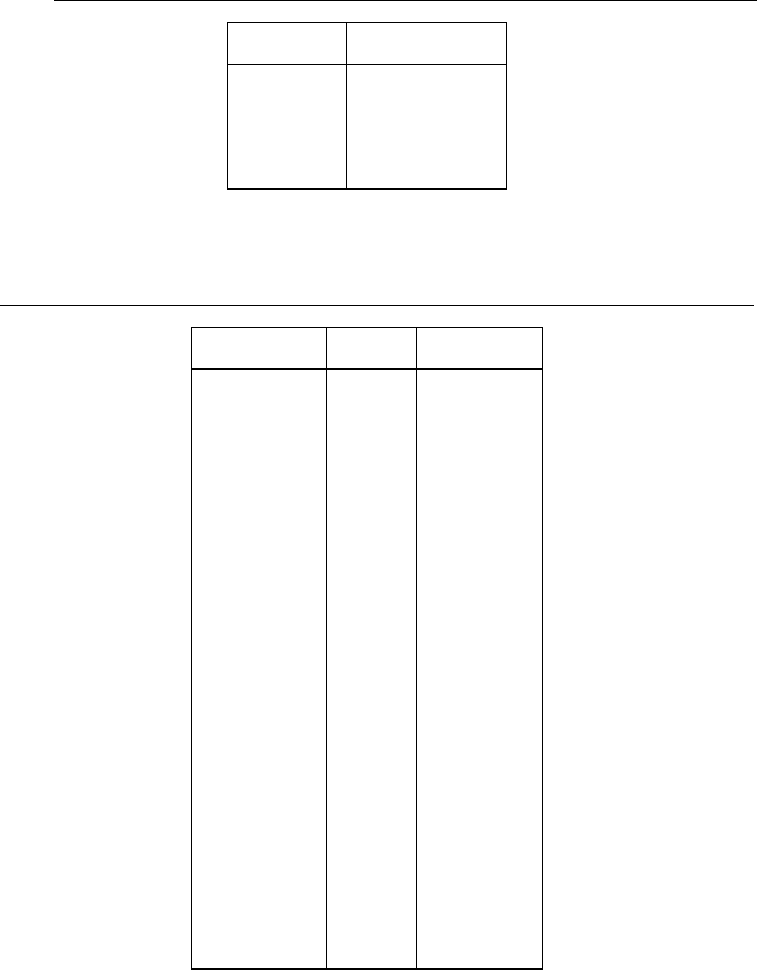
TABLE I. Penalty values, P, for LFSR signature analyzers implementing primitive polynomial of degree k
.
K
p
k < 8
k = (8...15)
k = (16...23)
k > 23
1.0
0.05
0.01
0.0
TABLE II. Representative faults for the fault equivalence classes
.
Stuck-at faults
Type of logic line in logic model
s-a-1
s-a-0
s-a-0, s-a-1
s-a-0, s-a-1
s-a-0, s-a-1
Every input of multiple-input AND or NAND gates
Every input of multiple-input OR or NOR gates
Every input of multiple-input components
that are not AND, OR, NAND, or NOR gates
Every logic line that is a fan-out origin
Every logic line that is a primary output
Note: "s-a-0" is stuck-at-zero and "s-a-1" is stuck-at-one.
MIL-STD-883F
METHOD 5012.1
27 July 1990
10
TABLE III. Sample sizes used to obtain lower bound on fault coverage using fault simulation procedure 2.
r
n
0.01
0.015
0.02
0.03
0.04
0.05
6860
3070
1740
790
450
290
NOTE: "n" is the minimum sample size required for a chosen penalty "r".
TABLE IV. Sample sizes used to accept/reject lower bound on fault coverage using fault simulation procedure 3
.
F
n F'
50.0%
55.0%
60.0%
65.0%
70.0%
75.0%
76.0%
77.0%
78.0%
79.0%
80.0%
81.0%
82.0%
83.0%
84.0%
85.0%
86.0%
87.0%
88.0%
89.0%
90.0%
91.0%
92.0%
93.0%
94.0%
95.0%
96.0%
97.0%
98.0%
99.0%
5
6
6
7
9
11
11
12
13
13
14
15
16
17
18
19
20
22
24
26
29
32
36
42
49
59
74
99
149
299
87.1%
89.1%
89.1%
90.6%
92.6%
93.9%
93.9%
94.4%
94.8%
94.8%
95.2%
95.5%
95.8%
96.0%
96.2%
96.4%
96.6%
96.9%
97.2%
97.4%
97.6%
97.9%
98.1%
98.4%
98.6%
98.8%
99.1%
99.3%
99.5%
99.8%
NOTE: For a given minimum required fault coverage "F" simulate "n" faults. If all faults are detected, then conclude that the
actual fault coverage is greater than or equal to "F". Otherwise, conclude that the actual fault coverage is less than "F." The
column labeled "F'" shows the actual fault coverage that has a 50 percent probability of acceptance.