Nordson_EFD_OptiSure_Operating_Manual - 第66页
OptiSure Automated Optical Inspection 66 www.nordsonefd.com info@nordsonefd.com +1-401-431-7000 Sales and service of Nordson EFD dispensing systems are available worldwide. Using the Laser to Measur e and Recor d Profile…
OptiSure Automated Optical Inspection
65www.nordsonefd.com info@nordsonefd.com +1-401-431-7000 Sales and service of Nordson EFD dispensing systems are available worldwide.
# Click Step Reference Image
7
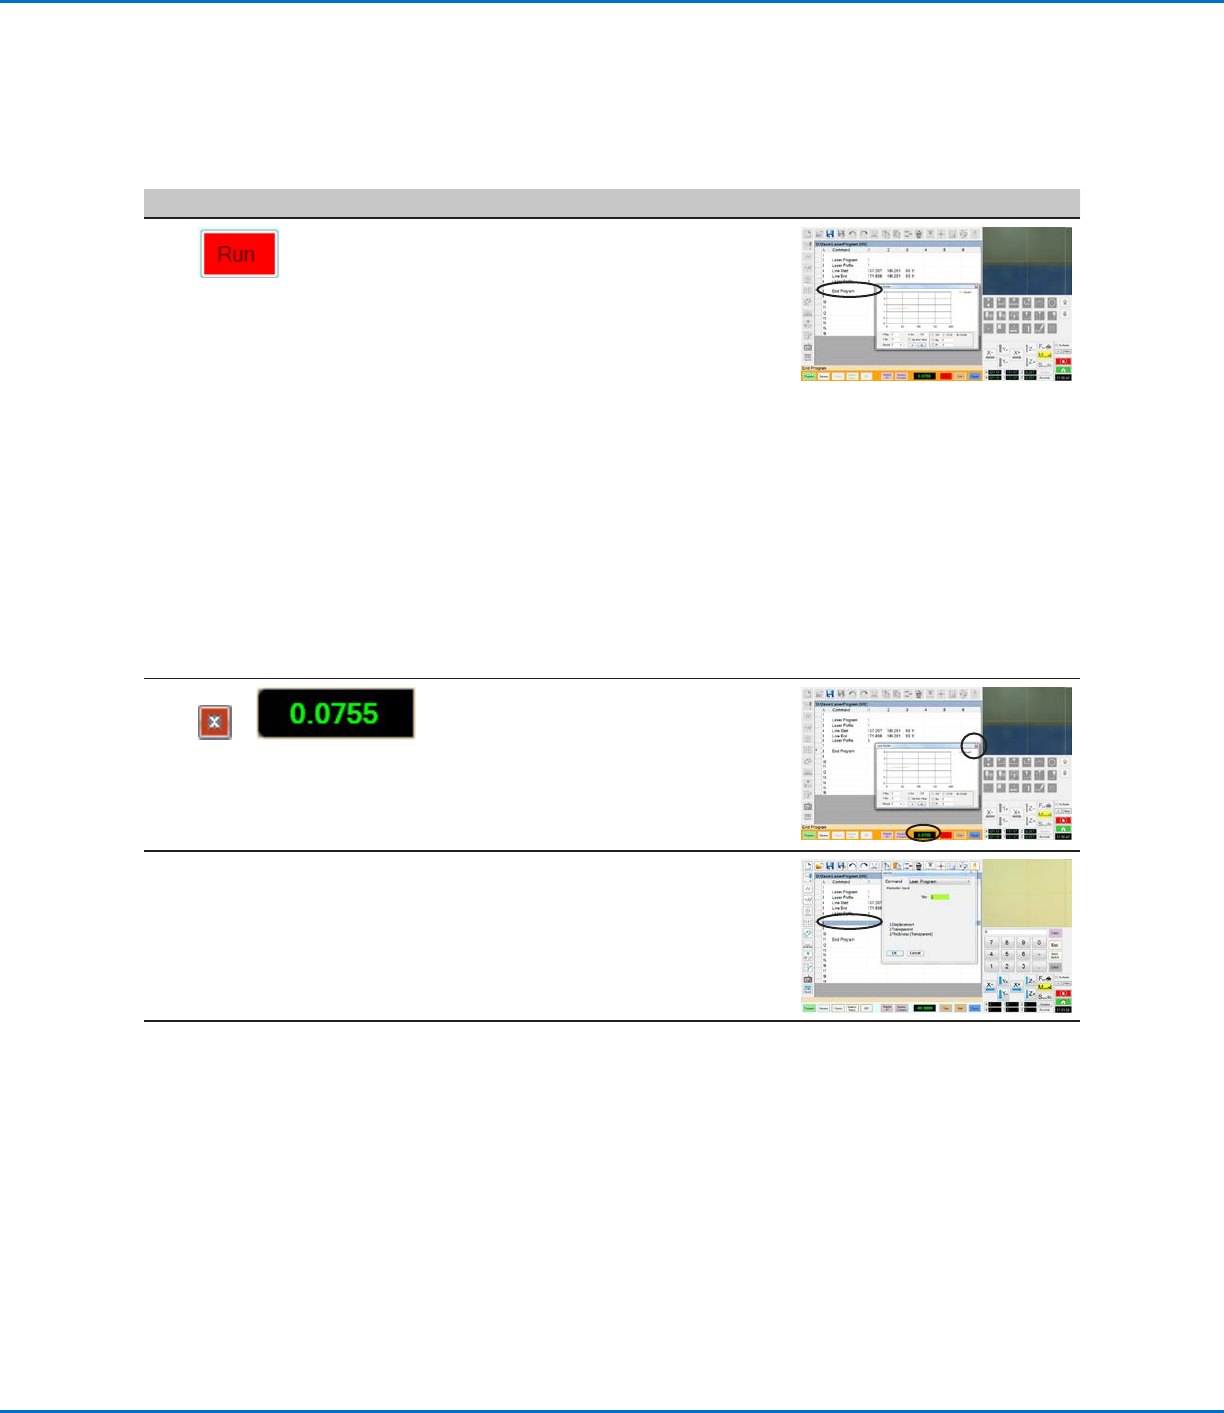
• Click RUN to test the program,
observing that the Laser Profile
window opens.
The laser uses the specified laser program to measure whatever is under
the camera, whether it is a dispensed fluid or a workpiece surface. For
correct laser measurement results, the laser program must be tailored to
the characteristics (transparency, thickness, etc.) of the fluid or workpiece
being measured.
NOTES:
- For details on the Laser Profile window, refer to “Laser Profile Window
Fields” on page67.
- To use the Laser Profile window to check whether laser measurements
are within a specified range of threshold values, refer to “To Check
Laser Measurements Against Threshold Values” on page67.
8
or
• Click the red X to close the Laser
Profile window.
• Double-click the LASER READ-OUT
field to re-open the Laser Profile
window.
9 • Optional: Repeat steps 2–5 and enter
another laser program selection in the
Laser Program command window;
also try different workpieces to test
other laser program settings.
Continued on next page
Using the Laser to Measure and Record Profiles
(continued)
To Measure and Record the Profile of a Fluid or a Workpiece (continued)
OptiSure Automated Optical Inspection
66 www.nordsonefd.com info@nordsonefd.com +1-401-431-7000 Sales and service of Nordson EFD dispensing systems are available worldwide.
Using the Laser to Measure and Record Profiles
(continued)
To Measure and Record the Profile of a Fluid or a Workpiece (continued)
# Click Step Reference Image
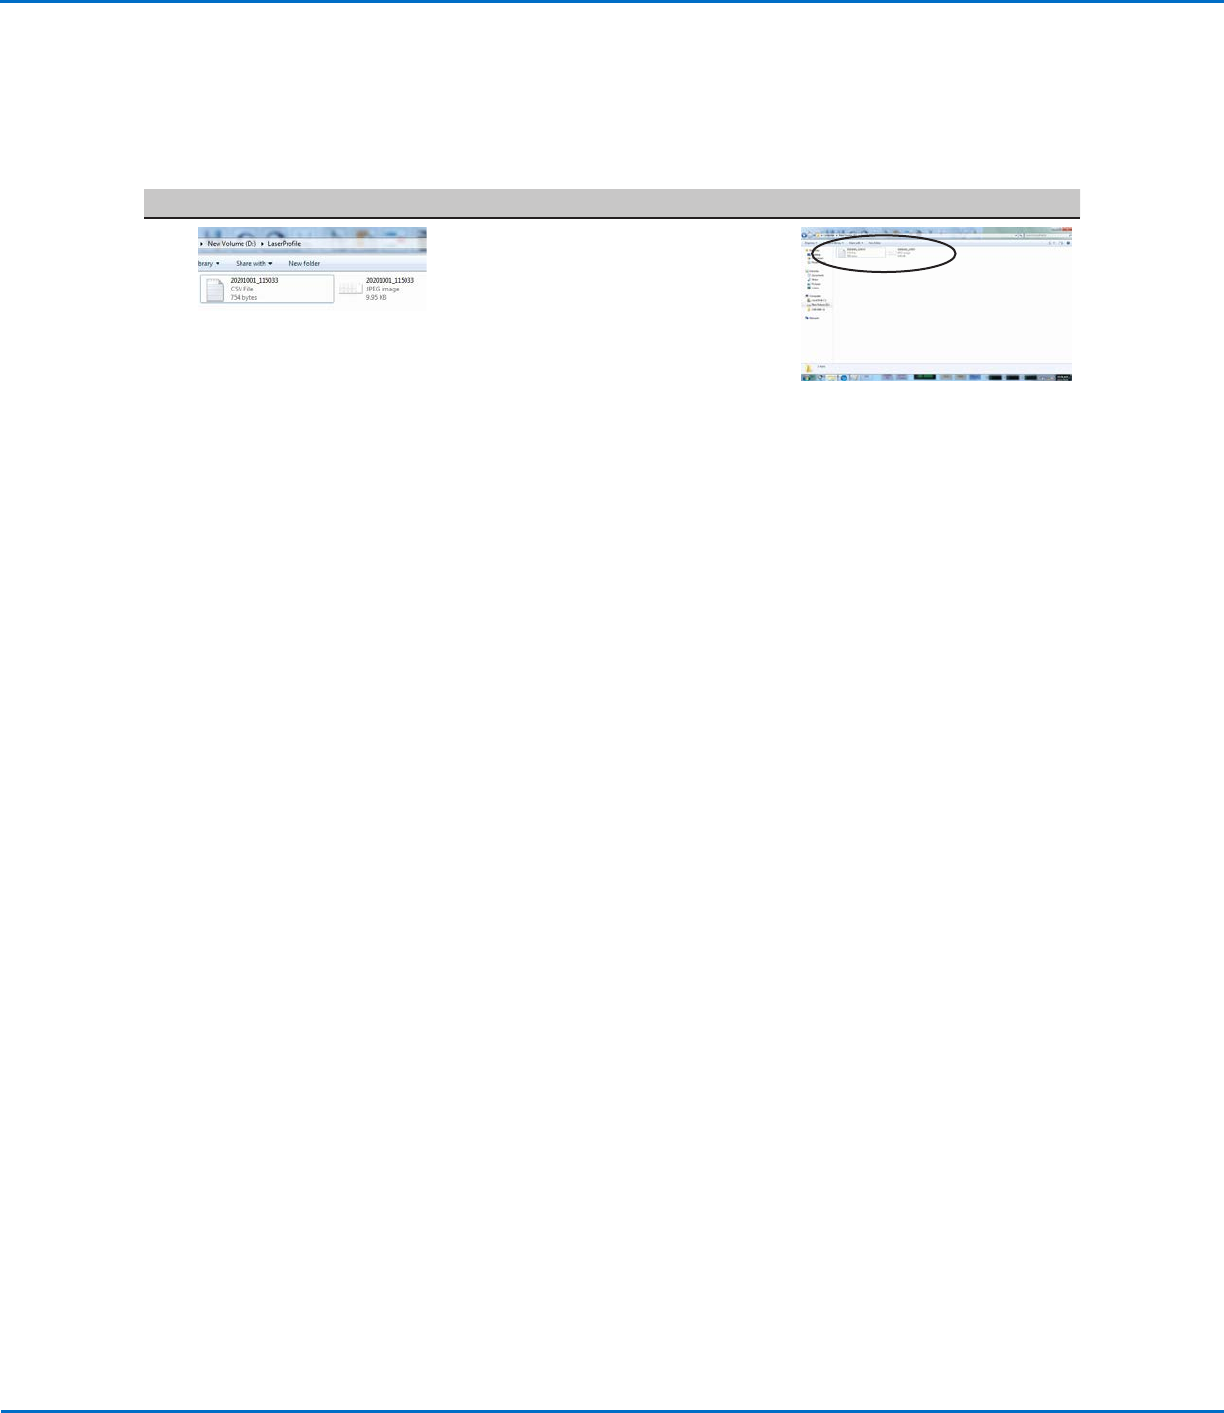
10
• Go to D:\Laser Profile to see
the saved graph and data point
(measurement data) files. Graphs and
data points are saved automatically
after every run cycle.
NOTES:
• All *.CSV and *.JPEG files are named with the date and time using the
following format:
- YYYYMMDD_HrMinSecs.CSV
- YYYYMMDD_HrMinSecs.JPEG
• Every subsequent laser program will have an underscore and a number.
For example:
YYYYMMDD_HrMinSecs_1.CSV, YYYYMMDD_HrMinSecs_1.JPEG
YYYYMMDD_HrMinSecs_2.CSV, YYYYMMDD_HrMinSecs_2.JPEG
OptiSure Automated Optical Inspection
67www.nordsonefd.com info@nordsonefd.com +1-401-431-7000 Sales and service of Nordson EFD dispensing systems are available worldwide.
To Check Laser Measurements Against Threshold Values
When the laser is measuring and recording, you can use the Laser Profile window to specify Max and Min threshold
(tolerance) values and to select the alert option to appear when a measurement is outside of the specified Max and /
or Min thresholds.
# Click Step Reference Image
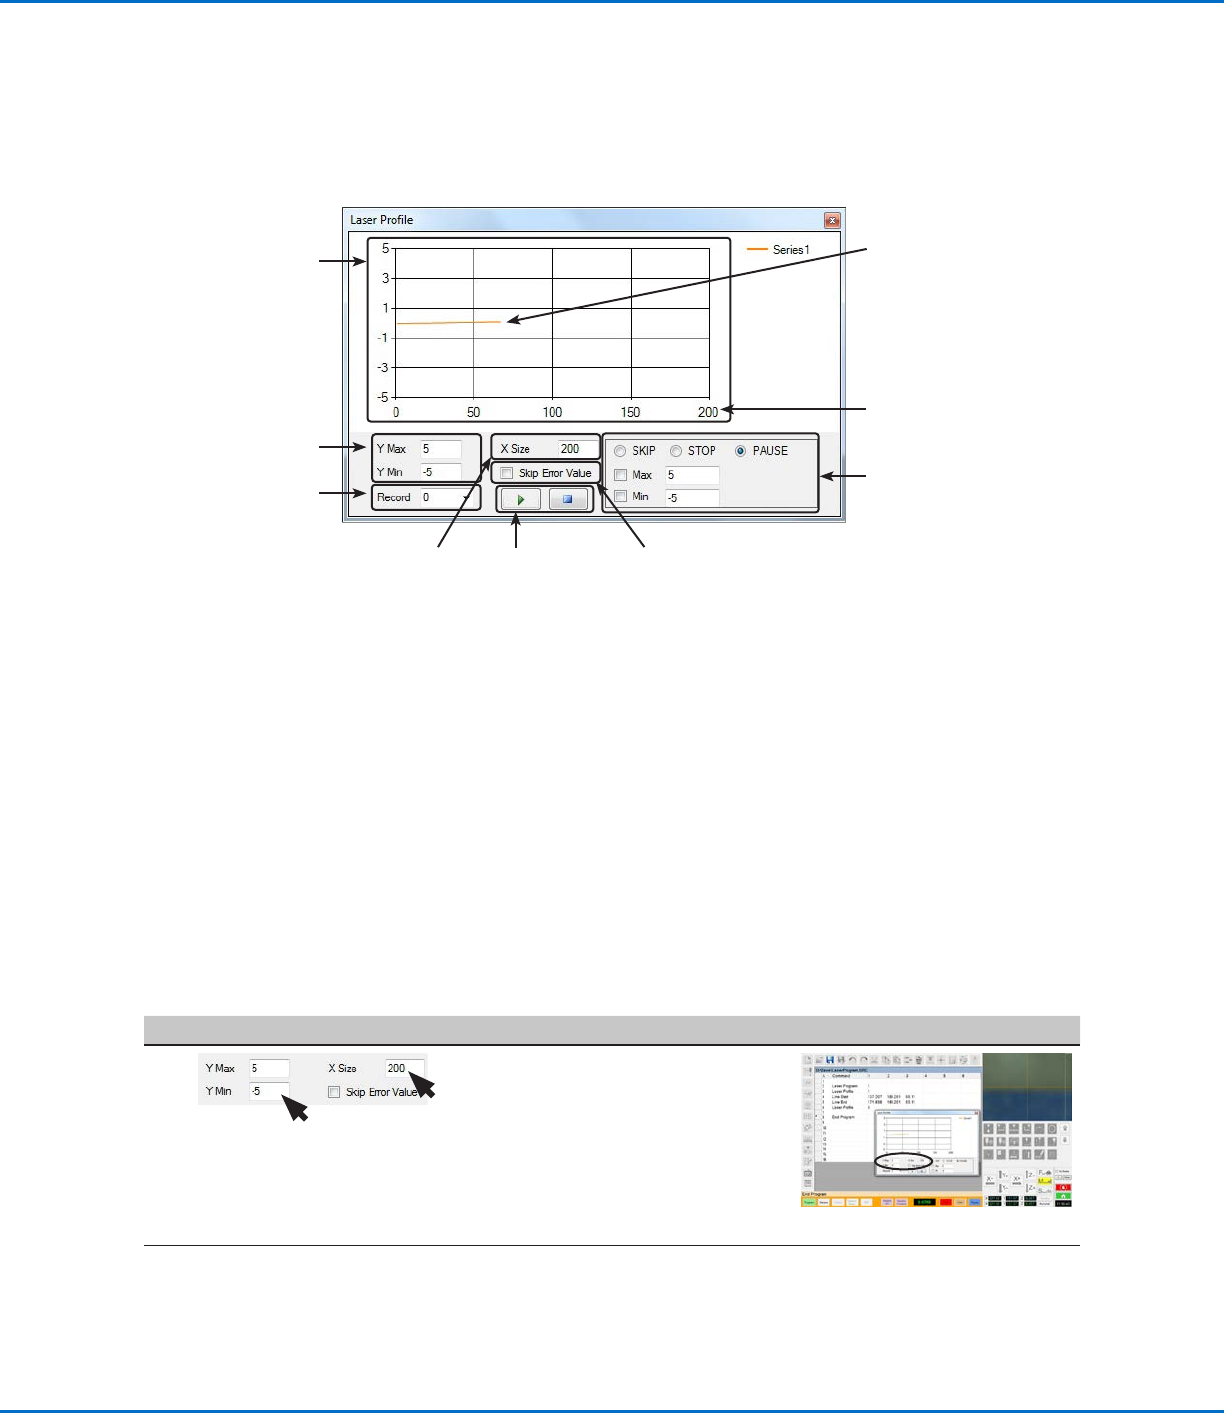
1
• Ensure that the following values are
properly set:
- Y MAX and Y MIN: The maximum
and minimum values for the vertical
axes (in mm).
- X SIZE: The number of laser
readings to show in the graph (the
minimum is 101).
Continued on next page
Using the Laser to Measure and Record Profiles
(continued)
Play or pause
the graph
Graph
Sets the
maximum and
minimum values
for the vertical
axes (in mm)
Shows the record
number associated with
the laser program that
is running (for example,
if the robot dispense
program specifies
laser programs 1 and
2 (in that order), then
Record 0 is tied to
laser program 1 and
Record 1 is tied to laser
program 2)
Sets maximum and
minimum threshold
(tolerance) values for the
measurement results and,
if enabled by checking Max
and / or Min, specifies the
desired system response
(Skip, Stop, or Pause)
when a measured value is
out of range. Refer to “To
Check Laser Measurements
Against Threshold Values”
on page67 for details.
Sets the number of
laser readings to
show in the graph
(minimum is 101)
Laser Profile Window Fields
If Skip Error Value is
checked, then the
graph excludes any
measurements outside of
Y Max and Y Min
XSize value (200, in this
example)
Shows the number of laser
readings that will be in the
*.CSV file. For example, if
recording is stopped at 60,
then there will be 60 laser
readings inside the *.CSV
file.
NOTE: Recording can continue
past the X Size. For example, if
the X Size is set to 200, but you
have 300 laser readings, only the
first 200 readings are shown on
the graph. You can change the
X Size value during or after laser
measurement.