2OM-1751-003w_G5S.pdf - 第229页
2OM-1751 4-15 1303-001 2.3 "NozMng." T ab Sheet The corresponding tab sheet enables the operator to view the nozzle management data. When the [NozMng.] tab is pressed in the "MNG.DT." window, the foll…

2OM-1751
4-141303-001
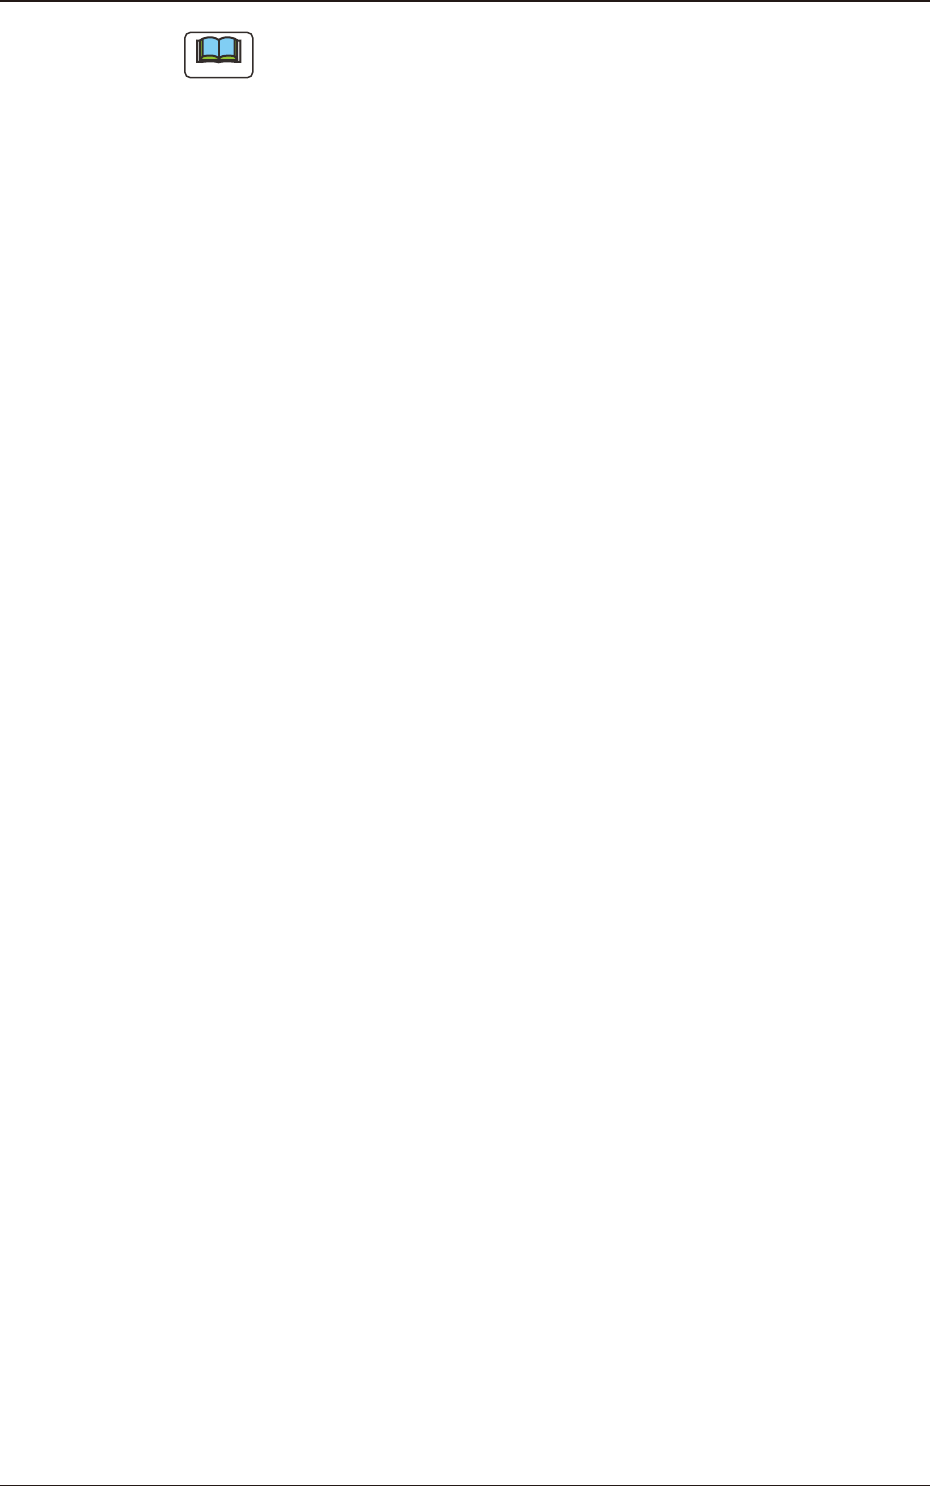
[13] G:Comp. Posture
Each text box shows the total times of front/rear judgement error or polarity
error in each feeder in the recognition processing.
[14] H:Meas. Error
Each text box shows the total times of measured value error in each feeder.
[15] K:Copla. Error
Each text box shows the total times of detected "Coplanarity Error" in each
feeder. This error is detected in the option attachment.
[16] L:Obv / Reverse
The No. of front/rear error times for each feeder detected using the linear
measure, is displayed in this data box.
[17] Shrtg. of Comp.
Each text box shows the total times of detected "Component Shortage" in
each feeder.
[18] Update Date & Time for Each Feeder
Each test box shows the update date & time for each feeder.
2.2 "FdrMng." Tab Sheet
2OM-1751
4-151303-001
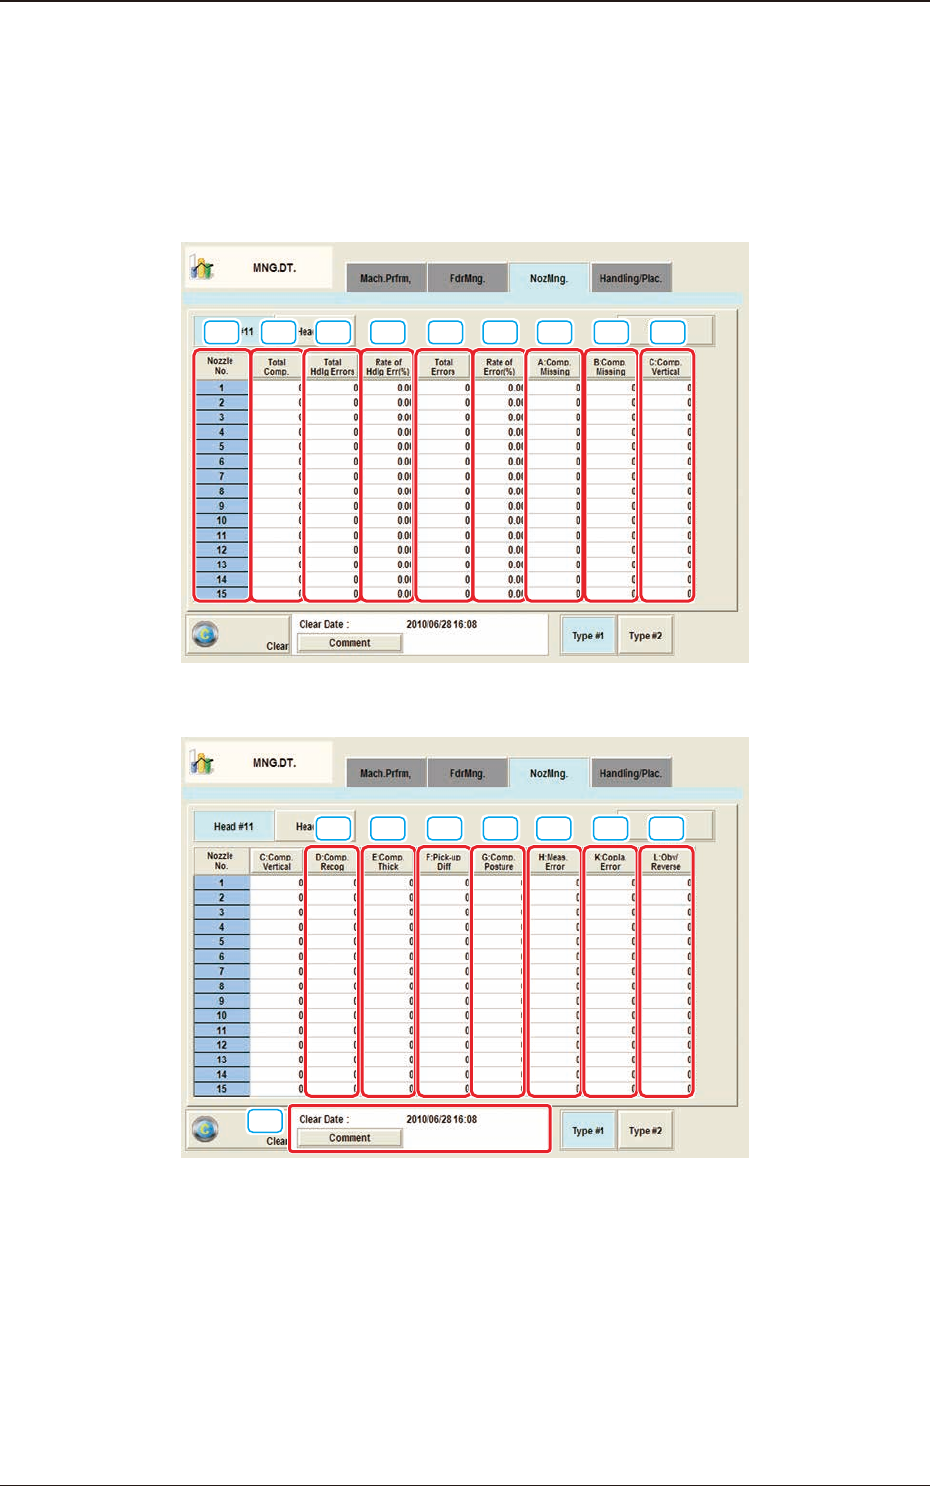
2.3 "NozMng." Tab Sheet
The corresponding tab sheet enables the operator to view the nozzle management
data.
When the [NozMng.] tab is pressed in the "MNG.DT." window, the following tab
sheet appears inside the window.
[5] [6] [7][2][1] [3] [4] [8] [9]
"NozMng." Tab Sheet (1/2) F2D10
[11] [12] [13]
[17]
[14] [15] [16][10]
"NozMng." Tab Sheet (2/2) F2D11
2.3 "NozMng." Tab Sheet
2OM-1751
4-16
Note
(a) The displayed tab sheet will look different, depending on which option is
selected.
(b) When one of the above buttons is pressed, the nozzle No. with the biggest
parameter under the selected button is displayed in the rst line and nozzle
Nos. having the subsequent (second, third, fourth, ...) biggest parameters
follow.
That is, parameters are re-arranged in order of error counts, making it easy
to analyze and improve production rate.
When the [Noz.] button is pressed, the Nos. are re-arranged in their initial
order (Nozzle Nos.).
The "NozMng." tab sheet is divided further into four buttons and each subtab
sheet shows the nozzle management data for each individual head #.
When a button is pressed, the corresponding subtab sheet appears.
[1] Nozzle No.
Shown are the nozzle Nos.
[2] Total Comp
Each text box shows the number of pickup actions for each individual
nozzles.
[3] Total Hdlg Errors
The No. of pick-up error total times is displayed in this data box.
[4] Rate of Hdlg Err (%)
The percentage of the pick-up error total times to the total pick-up times is
displayed in this data box.
[5]
Total Errors
Each text box shows the total number of errors detected in [7] through [17].
[6] Rate of Error (%)
Each text box shows the percentage of the total number of errors per the
number of picked components.
[7] A:Comp. Missing
Each text box shows the number of missing components detected by the
linear measure detection sensor for each individual nozzles.
[8] B:Comp. Missing
Each text box shows the number of missing components detected through
recognition operation for each individual nozzles.
1303-001
2.3 "NozMng." Tab Sheet