8_PO-CON1692E - 第4页
4 Analysis of 25-OH Vitamin D2/D3 in Serum by LC-MS/MS with full-automated sample preparation Fig. 3 Calibration Curves (L1-L4) and MRM Chromatograms (L1) The calibration curves showed good linearity (R^2>0.999) over …
3
Analysis of 25-OH Vitamin D2/D3 in Serum by LC-MS/MS with
full-automated sample preparation
Method
Compounds were measured using a commercially
available test kit ClinMass
®
LC-MS/MS Complete Kit for
25-OH-Vitamin D2 / D3, MS7000 (RECIPE Chemicals +
Instruments GmbH, Dessauerstraße 3, 80992 München,
Germany). Calibrators, control samples, analytical column
and mobile phase solvents were provided by the kit.
These calibrators and controls were loaded directly into
the CLAM-2000 for sample processing.
The CLAM-2000 was programmed to perform protein
precipitation using precipitant solution followed by ltration
and sample collection. Sample preparation involved
taking 30 μL of sample, adding to it 90 μL of precipitant
solution (containing internal standard). Following
ltration, the ltrated sample is then transported using an
arm from the CLAM-2000 to the HPLC for LC-MS/MS
analysis and no human intervention was required (Fig. 2).
The LC-MS/MS instrument was equipped with an
atmospheric pressure chemical ionization source (APCI).
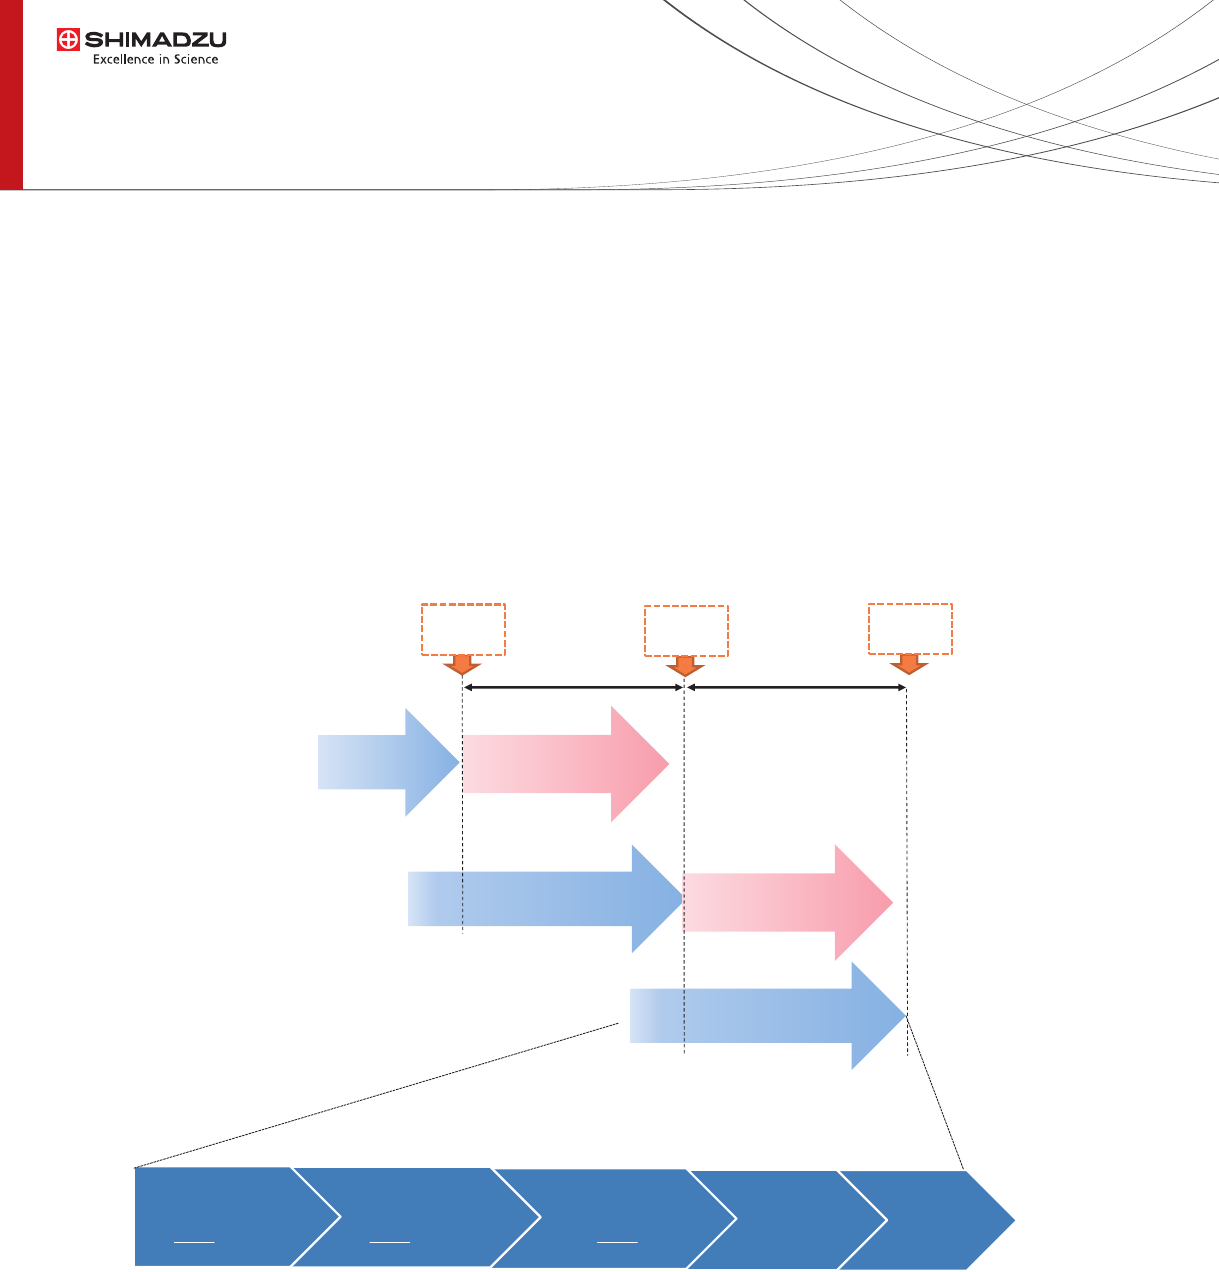
Sample Preparation
5min
LC/MS/MS analysis
3.2min
Sample Preparation
5min
LC/MS/MS analysis
3.2min
4.2min 4.2min
Sample
injection
Sample
injection
Sample
injection
Sample
Preparation
5min
Fig. 2 Analytical Flow with Parallel Processing
Reagent
Dispensing
• 20 µL of MeOH
Sample
Dispensing
• 30 µL of Serum
Reagent
Dispensing
• 90 µL IS
Shaking
• 30sec
Filtration
• 90sec
4
Analysis of 25-OH Vitamin D2/D3 in Serum by LC-MS/MS with
full-automated sample preparation
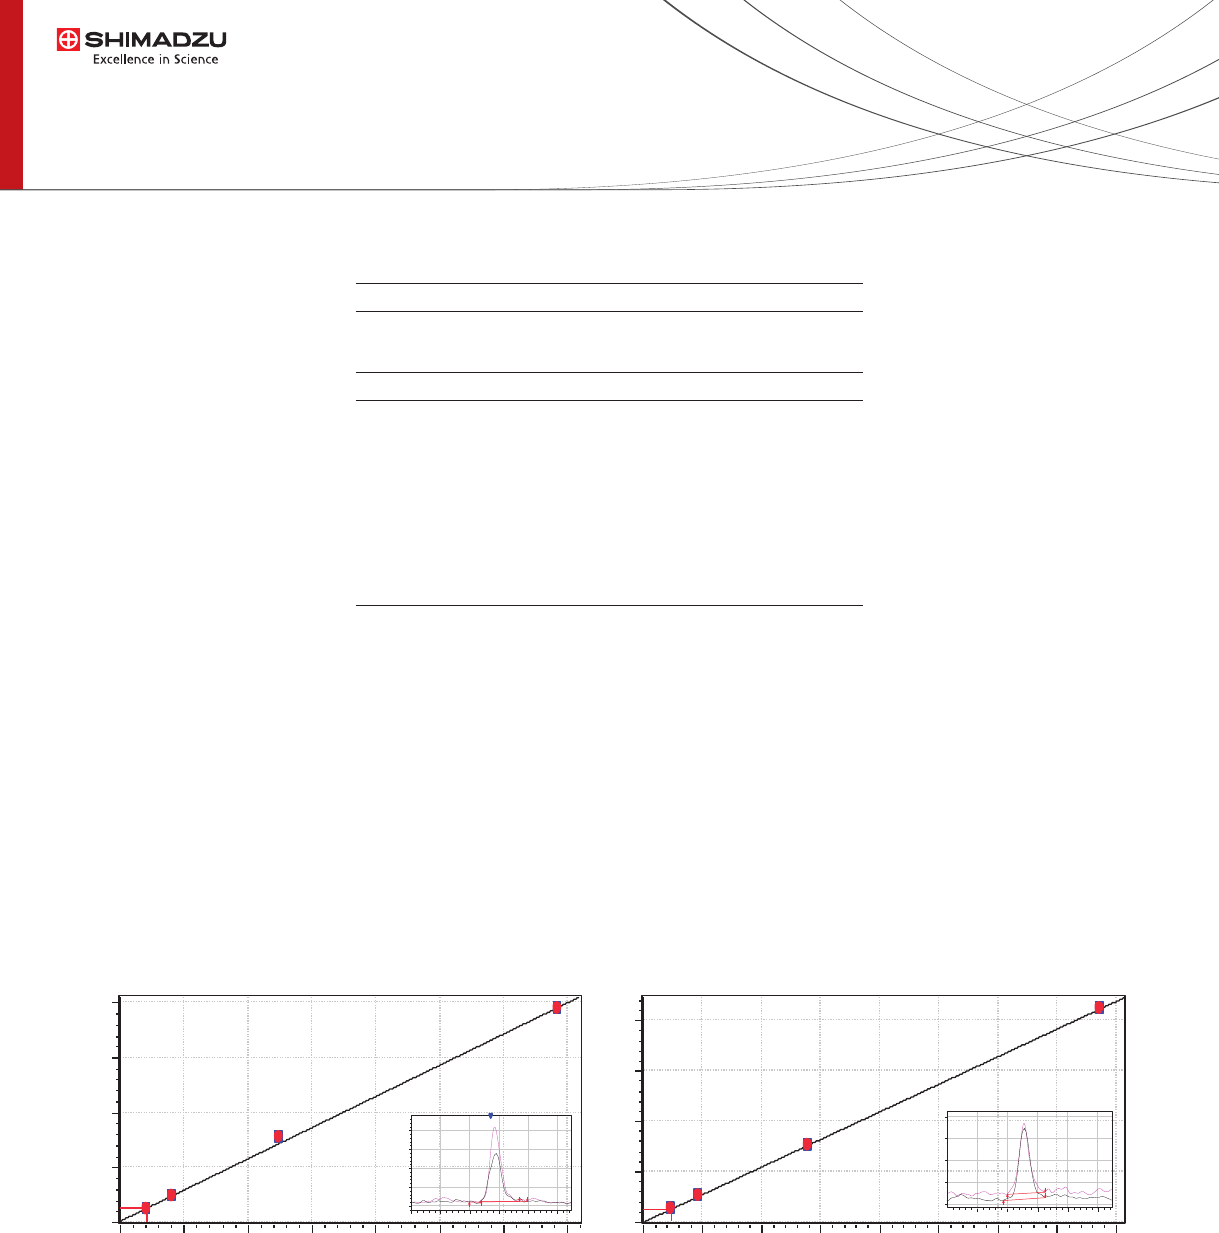
Fig. 3 Calibration Curves (L1-L4) and MRM Chromatograms (L1)
The calibration curves showed good linearity (R^2>0.999)
over a clinical relevant range of 4.10 - 68.5 μg/L for
25-OH Vitamin D2 and 4.68 - 77.3μg/L for 25-OH
Vitamin D3 (Fig 3). The reproducibility (N=7) at three
concentrations, including LLOQ, of each compounds was
excellent (CV<6.5%). Different day reproducibility (N=7)
for 3 days at three concentrations as well (CV<7.2%)
(Table 2).
Linearity, Precision
Result and discussion
Column Temp. : 40 ºC
Injection Volume : 30 μL
[LC] NexeraX2 System
Ionization : APCI Positive
Source conditions :
Nebulizer Gas : 1.5 L/min
Interface temperature : 375 °C
Desolvation Line : 225 °C
Heat Block temperature : 250 °C
Drying Gas : Off
Scan Type : MRM
[MS] LCMS-8050
Table 1 Analytical Condition
0 10 20 30 40 50 60 Conc. Ratio
0.00
0.25
0.50
0.75
1.00
Area Ratio
2.2 2.3 2.4 2.5 2.6 2.7
0
2500
5000
7500
10000
1:395.40>269.20(+)
1:395.40>209.20(+)
25-OH Vitamin D2
r
2
=0.999
0 10 20 30 40 50 60 70 Conc. Ratio
0.00
0.25
0.50
0.75
1.00
Area Ratio
2.3 2.4 2.5 2.6 2.7
0
2500
5000
7500
10000
2:383.40>211.20(+)
2:383.40>257.40(+)
r
2
=0.999
25-OH Vitamin D3
5
Analysis of 25-OH Vitamin D2/D3 in Serum by LC-MS/MS with
full-automated sample preparation
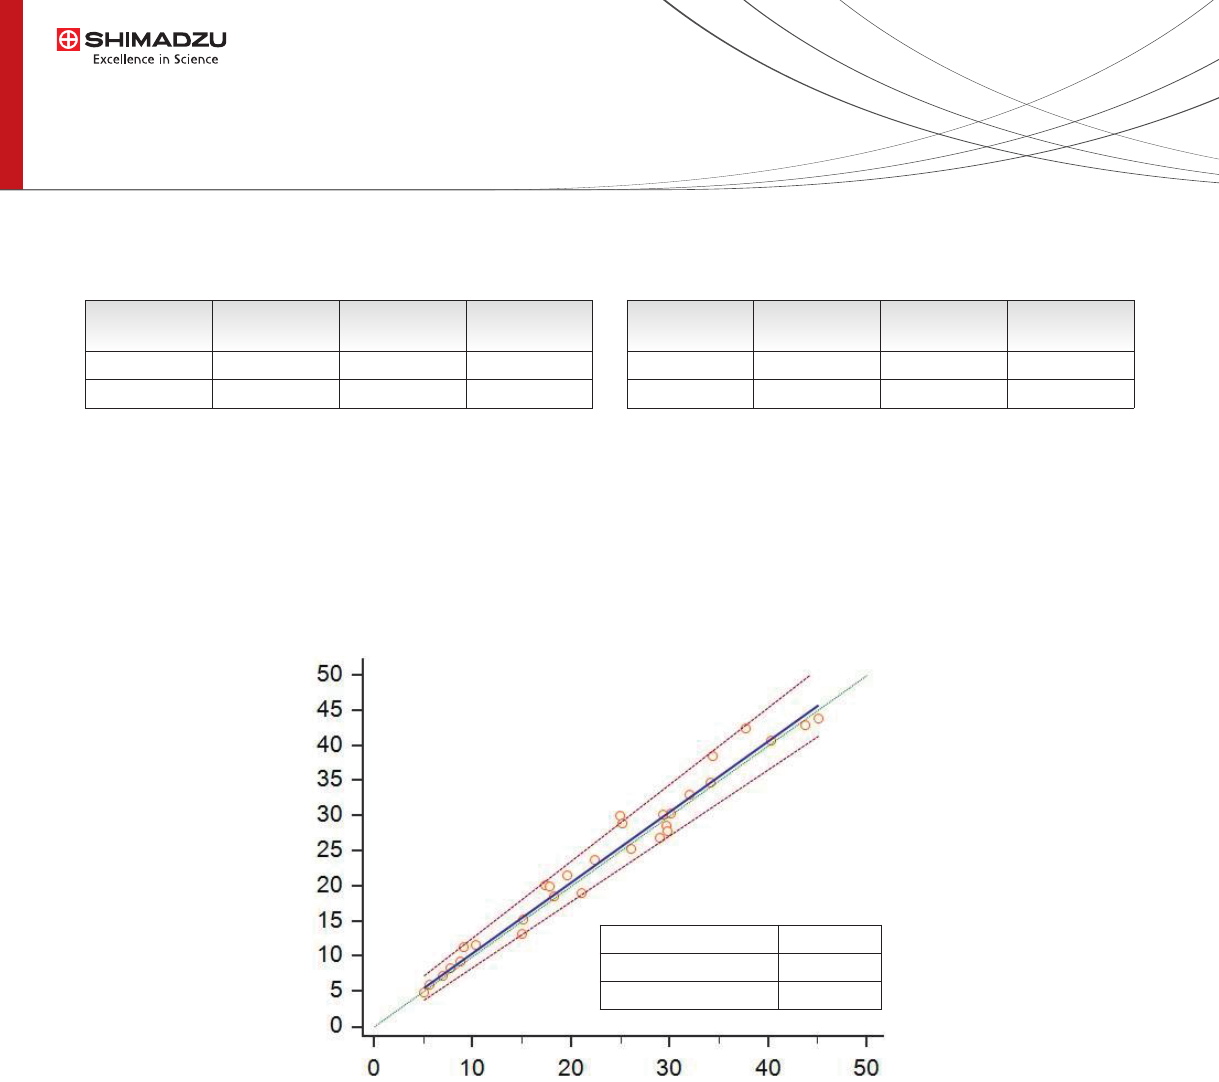
Fig. 4 Data correlation between Automatic sample preparation (CLAM-2000) and
Manual method (n=30 human serum samples + 2 reference material, Recipe)
Comparison of 25-OH Vitamin D3 concentration between manual sample preparation (following Recipe
specications) and automated sample preparation shows good agreement as highlighted by Passing and Bablok plot
and scores (Fig. 4).
Data correlation with Manual method
Table 2 Intra-assay and Inter-assay Precision (* n=7 ; ** 3 days)
Intra-assay*
Inter-assay**
CV%
4.4%
5.2%
LOW
(5.7μg/L)
2.3%
4.7%
Medium
(17.1μg/L)
1.1%
3.7%
High
(40.0μg/L)
25-OH Vitamin D2
Intra-assay*
Inter-assay**
CV%
2.9%
5.1%
LOW
(6.3μg/L)
5.1%
5.3%
Medium
(18.9μg/L)
2.4%
5.2%
High
(43.0μg/L)
25-OH Vitamin D3
Intercept A (95%CI)
Slope (95%CI)
Corr. Coeff. (P<0,0001)
0,41
1,006
0,98
CLAM-2000
Manual Sample Preparation