1OPERATION_.pdf - 第237页
CARRIAGE SEL . ICRS . J 1 I 1 ICRG . J 2 H ^ I E p 略 SCREENS Fig . 4.38 - 1 A • When one of the data keys is pressed , a feeder No . where the biggest parameter is set under the selected data key is displayed in the firs…
1
PT
.
ERRORS
(
Blue
)
2
PT
.
ERRORS
(
Light
Green
)
3
PT
.
ERRORS
(
Blue
)
4.10
MANAGEMENT
DATA
②
TOTAL
P
.
E
.
C
.
RECOGNITION
ERRORS
Total
number
of
errors
detected
by
P
.
E
.
C
.
recognition
function
is
displayed
.
The
number
of
errors
detected
by
global
P
.
E
.
C
.
recognition
function
and
the
total
number
of
errors
detected
by
B
.
B
.
R
.
recognition
function
are
displayed
.
1
PT
.
ERRORS
(
%
OF
TOTAL
P
.
E
.
C
.
ERR
)
The
total
number
of
errors
detected
on
first
fiducial
mark
by
P
.
E
.
C
.
recognition
function
and
the
percentage
of
the
total
number
of
errors
on
first
fiducial
mark
per
total
number
of
all
errors
detected
by
the
P
.
E
.
C
.
recognition
function
are
displayed
.
2
PT
.
ERRORS
(
%
OF
TOTAL
P
.
E
.
C
.
ERR
)
The
total
number
of
errors
detected
on
second
fiducial
mark
by
P
.
E
.
C
recognition
function
and
the
percentage
of
the
total
number
of
errors
on
second
fiducial
mark
per
total
number
of
all
errors
detected
by
the
P
.
E
.
C
.
recognition
function
are
displayed
.
3
PT
.
ERRORS
(
%
OF
TOTAL
P
.
E
.
C
.
ERR
)
The
total
number
of
errors
detected
on
third
fiducial
mark
by
P
.
E
.
C
.
recognition
function
and
the
percentage
of
the
total
number
of
errors
on
third
fiducial
mark
per
total
number
of
all
errors
detected
by
the
P
.
E
.
C
recognition
function
are
displayed
.
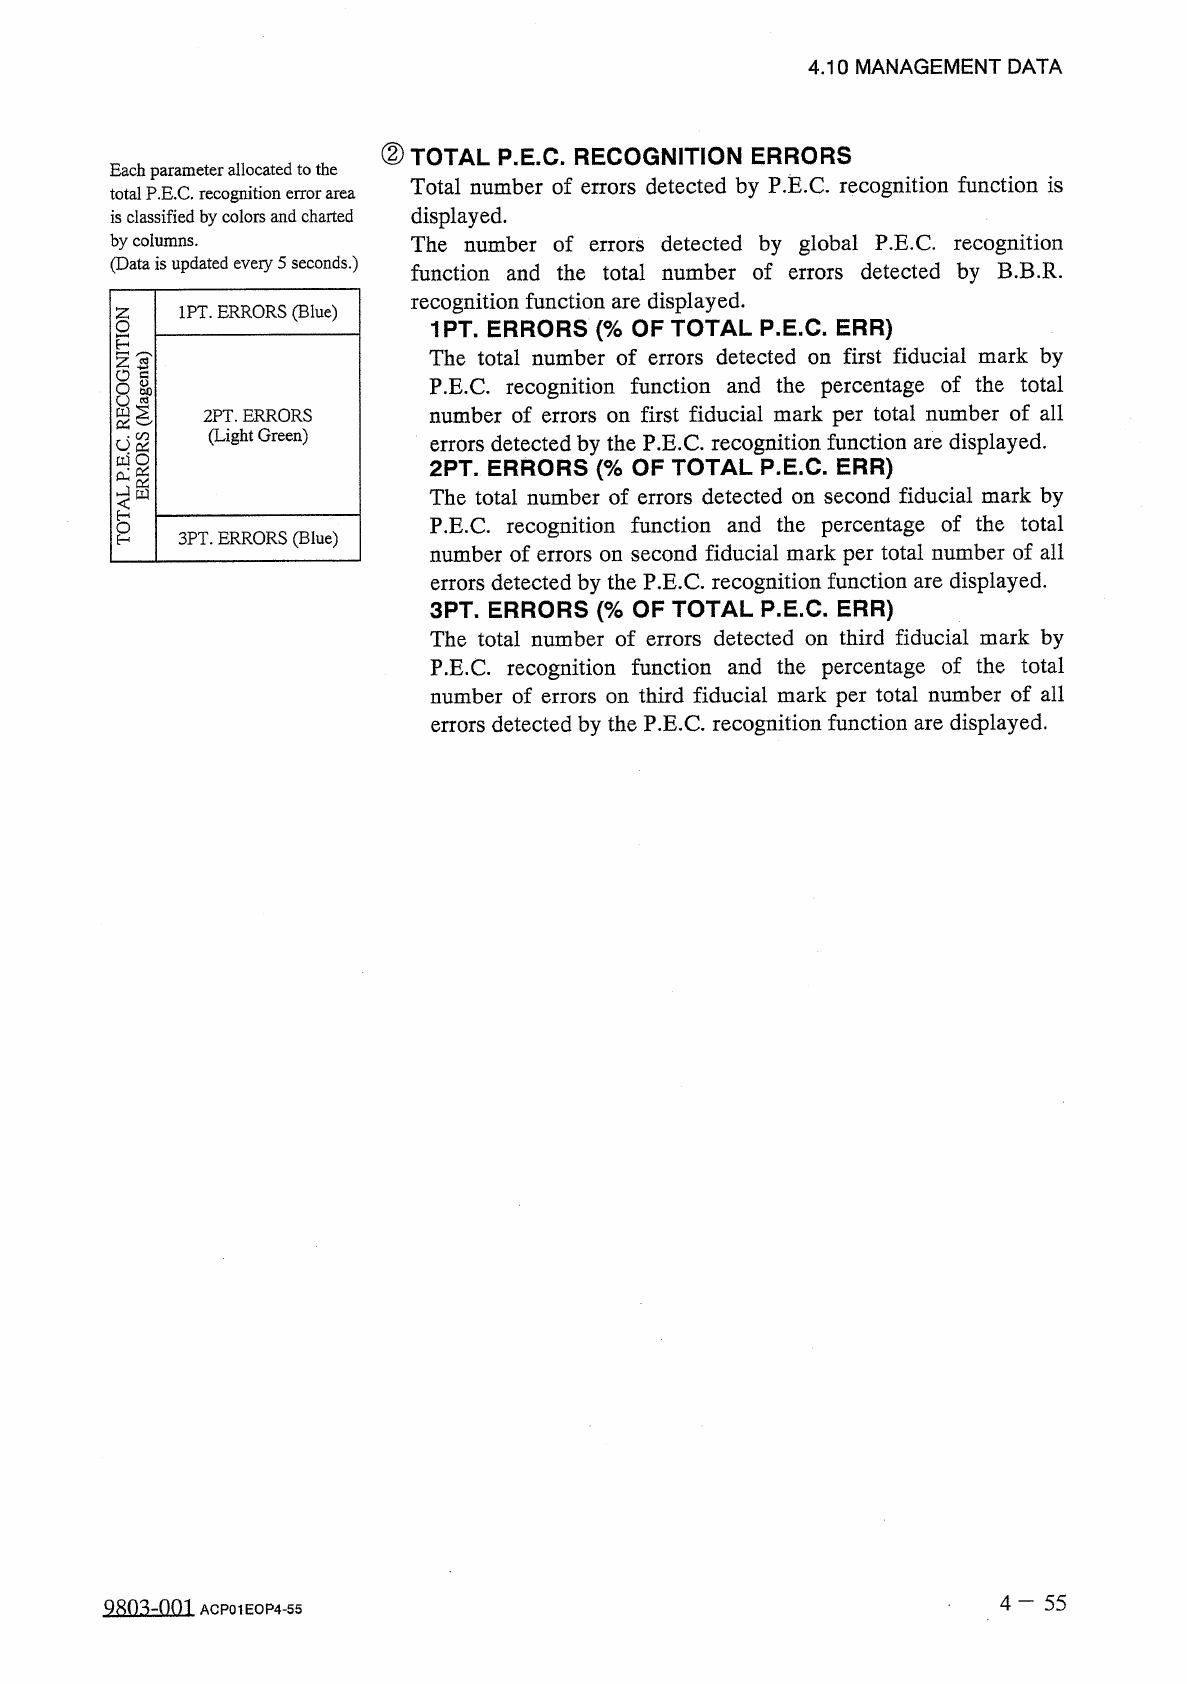
Each
parameter
allocated
to
the
total
P
.
E
.
C
.
recognition
error
area
is
classified
by
colors
and
charted
by
columns
.
(
Data
is
updated
eveiy
5
seconds
.
)
4
-
5 5
asoizOQi
ACP
01
EOP
4
-
55
(
B
-
S
&
BS
)
SHCmcds
Nougooomcotadvlol
CARRIAGE
SEL
.
ICRS
.
J
1
I
1
ICRG
.
J
2
H
^
IE
p
略
SCREENS
Fig
.
4.38
-
1
A
•
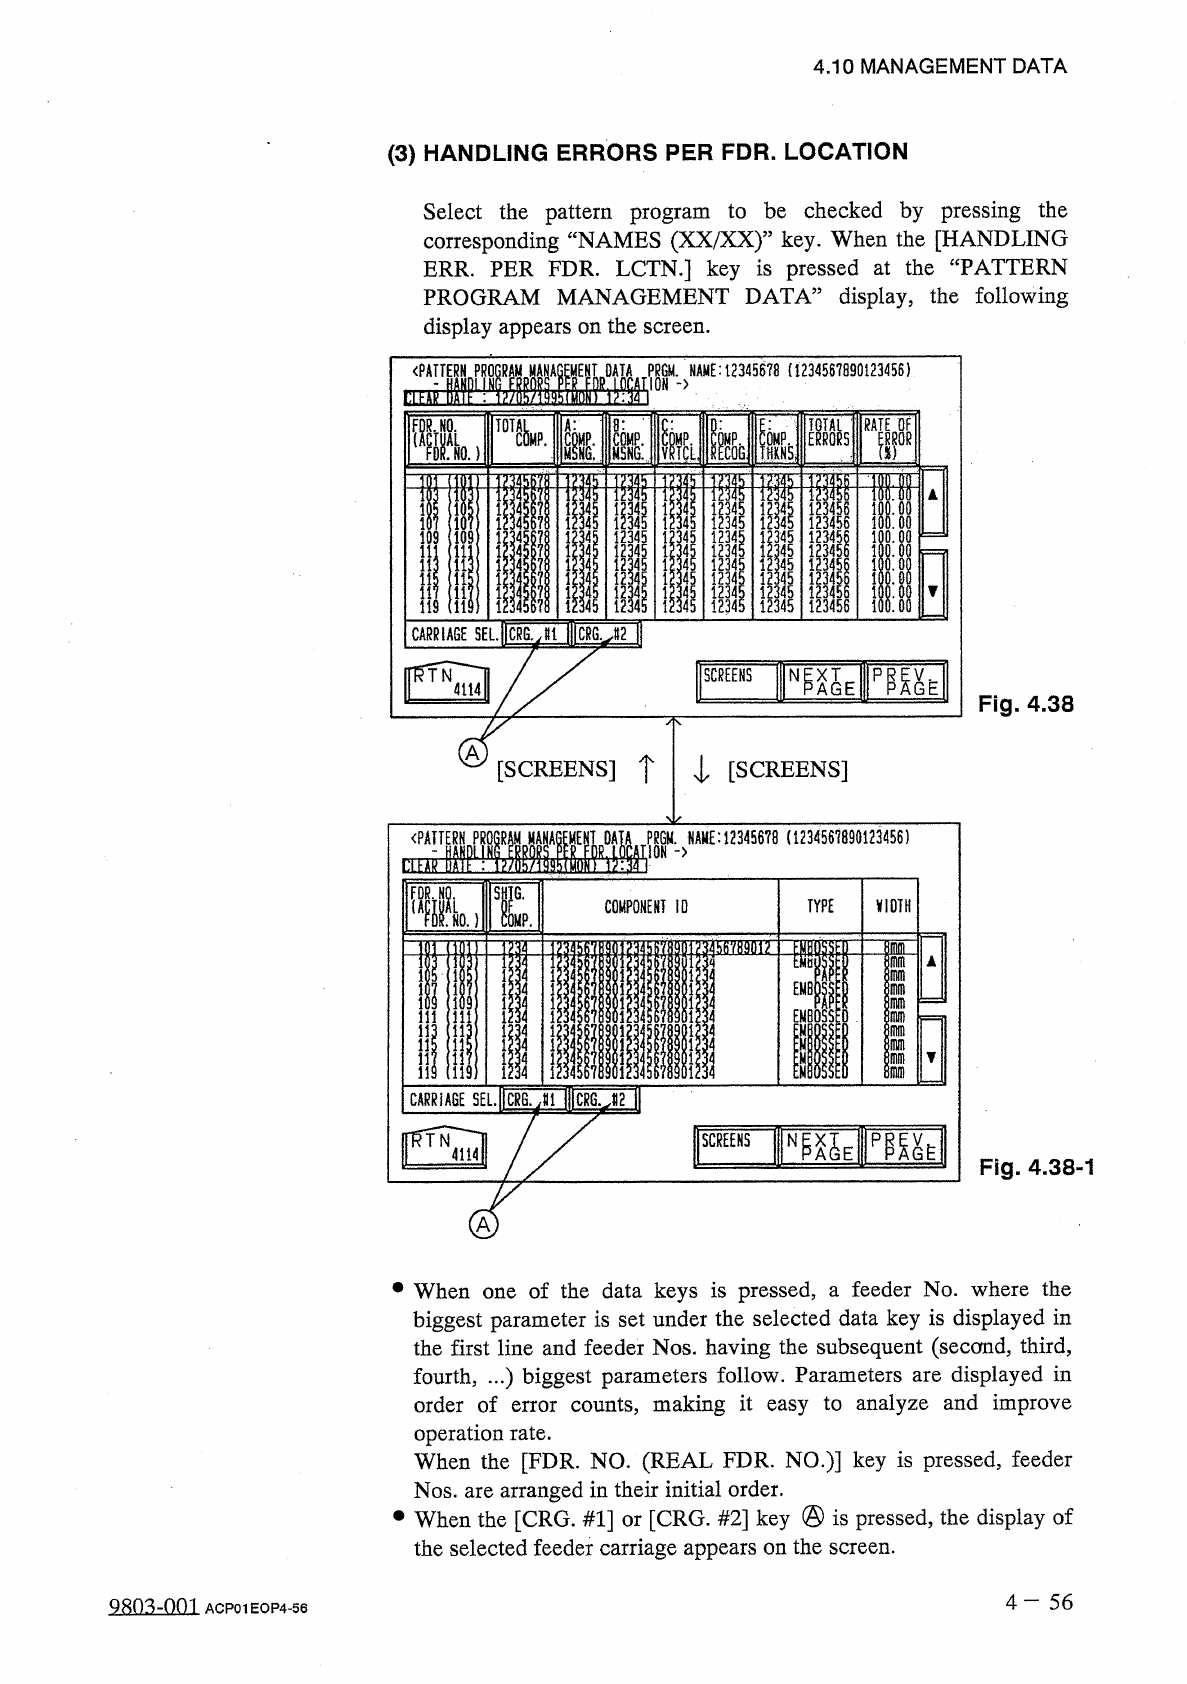
When
one
of
the
data
keys
is
pressed
,
a
feeder
No
.
where
the
biggest
parameter
is
set
under
the
selected
data
key
is
displayed
in
the
first
line
and
feeder
Nos
.
having
the
subsequent
(
second
,
third
,
displayed
in
fourth
,
.
.
.
)
biggest
parameters
follow
.
Parameters
order
of
error
counts
,
making
it
easy
to
analyze
and
improve
are
operation
rate
.
When
the
[
FDR
.
NO
.
(
REAL
FDR
.
NO
.
)
]
key
is
pressed
,
feeder
Nos
.
are
arranged
in
their
initial
order
.
•
When
the
[
CRG
.
#
1
]
or
[
CRG
.
#
2
]
key
@
is
pressed
,
the
display
of
the
selected
feeder
carriage
appears
on
the
screen
.
4
-
5 6
4.10
MANAGEMENT
DATA
(
3
)
HANDLING
ERRORS
PER
FDR
.
LOCATION
Select
the
pattern
program
to
be
checked
by
pressing
the
corresponding
“
NAMES
(
XX
/
XX
)
”
key
.
When
the
[
HANDLING
ERR
.
PER
FDR
.
LCTN
.
]
key
is
pressed
at
the
“
PATTERN
PROGRAM
MANAGEMENT
DATA
”
display
,
the
following
display
appears
on
the
screen
.
Fig
.
4.38
A
[
SCREENS
]
T
l
[
SCREENS
]
PSGM
.
>
NAME
:
123
«
6
?
8
(
1234561890123456
)
SL
1
:
,
TYPE
\
(
IDTH
COMPONENT
10
Q
803
-
Q
01
ACP
01
EOP
4
-
56
SCREENS
N
^
E
Ii
[
g
腦麵隨
nlinlrlfll
w
0
12
g
u
-
-
R
nuftuoo
OOAUO
删
If
OAUOO
oi
89
66566686
55555555
44
Jc
4
U
-
4
C
234567
ITA
'
RO
.
333333333
^
222222222
▲
<
-
,
!
.
«
■
•
«
•
-
44
-
i
.
nztll
-
‘
<
—
55555555
4
Jc
4
4
U
-
d
-
4
4
OJ
33
TJQJ
333
414
X
41414
IX
41
<
14
—
^
•
vioMtE
I
IAME
:
111
)
MP
!
ICi
PGON
^
55555555
JL
/
u
-
c
-
£
iL
4
W
3333
QJ
333
^
n
£
OL
222222
AJ
14
i
414
«
8
*
4
i
—
i
-
IAix
MPNG
i
8
:
lcolMS
1
OAR
.
l
ICRG
ffi
.
疏
81
EL
s
To
ft
GE
NK
RA
,
lu
XMUOO
*
-
*
r
.
il
A
J
l
<
I
4
IIJIIJ
-
«
14
~
麝
»
<
-
<
.
<
-
■
<
-
IJ
<
J
14
-
J
-
.
RIA
TE
CAR
<
p
4.10
MANAGEMENT
DATA
①
[
FDR
.
NO
.
(
ACTUAL
FDR
.
NO
.
)
]
Key
:
Feeder
(
Lane
)
Nos
.
Nos
.
in
(
)
show
those
of
the
feeders
to
which
offset
parameters
are
added
.
②
[
TOTAL
COMP
.
]
Key
Total
number
of
components
picked
at
each
feeder
(
lane
)
is
displayed
.
③
[
A
:
COMP
.
MSNG
.
]
Key
Total
number
of
missing
components
detected
by
the
component
posture
detection
sensor
at
each
feeder
is
displayed
.
④
[
B
:
COMP
.
MSNG
.
】
Key
Total
number
of
missing
components
detected
by
recognition
function
at
each
feeder
is
displayed
.
⑤
[
C
:
COMP
.
VRTCU
Key
Total
number
of
vertical
components
detected
by
the
component
posture
detection
sensor
at
each
feeder
is
displayed
.
⑥
[
D
:
COMP
.
RECOG
.
]
Key
Total
number
of
errors
detected
by
recognition
function
at
each
feeder
is
displayed
.
⑦
[
E
:
COMP
.
THKNS
.
]
Key
Total
number
of
component
thickness
component
posture
detection
sensor
for
each
feeder
is
displayed
.
detected
by
the
errors
⑧
[
TOTAL
ERRORS
]
Key
Total
number
of
errors
detected
in
②
through
®
is
displayed
.
⑨
[
RATE
OF
ERROR
(
%
)
]
Key
Percentage
of
errors
per
number
of
components
to
be
picked
up
is
displayed
.
⑩
[
SHTG
.
OF
COMP
.
]
Key
Total
number
of
component
shortage
errors
detected
at
each
feeder
is
displayed
.
⑪
[
COMPONENT
ID
]
Component
IDs
in
each
feeder
are
displayed
.
⑫
[
TYPE
]
Type
of
component
packaging
is
displayed
for
each
component
ID
.
(
PAPER
,
EMBOSSED
,
ADHESIVE
,
BULK
,
or
BULK
2
)
⑬
[
WIDTH
]
Tape
widths
are
displayed
for
each
component
ID
.
(
8
mm
,
12
mm
,
16
mm
,
24
mm
,
or
32
mm
)
4
一
57
QR
03
-
nm
ACP
01
EOP
4
-
57