AOI_RS_v85_en - 第108页
Chap ter3 SPC User Ma nual AOI Repair Station 104 we want to review the daily Cpk data during 2005/10/1 to 2005/10/31. In “Models List” section, system lists the all models that are tested in “Data Interval”, and y ou ca…
Chapter3 SPC User Manual
AOI Repair Station
103
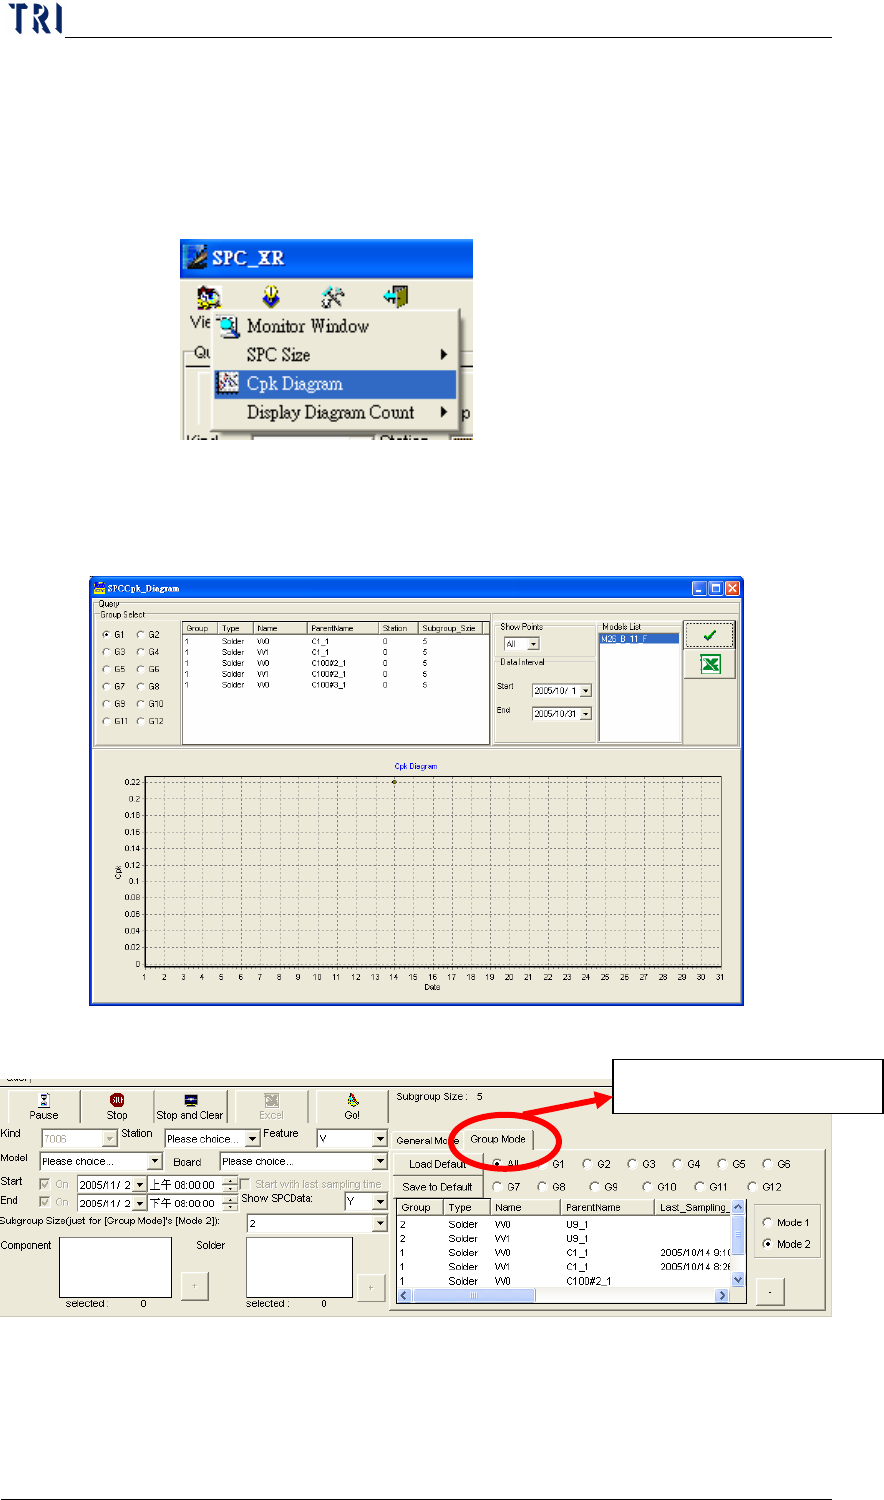
Cpk Diagram: When system executes monitoring, user can use
this function to review the daily Cpk data in a period of time. This
item will be enabled only when user starts the “Auto Output Daily
Report” function.
a. You can see the window as below. The “Query” section is to
set the conditions; you can select a group to monitor. So the
“Cpk Diagram” function is only for “Group Mode”.
b. “Show Points” is to set the number of counts you want to
display in the Cpk Diagram. “Data Interval” is to set the
period of time you want to see the daily Cpk data; in this case,
Must be “Group Mode”
Chapter3 SPC User Manual
AOI Repair Station
104
we want to review the daily Cpk data during 2005/10/1 to
2005/10/31. In “Models List” section, system lists the all
models that are tested in “Data Interval”, and you can select a
model to review the Cpk data.
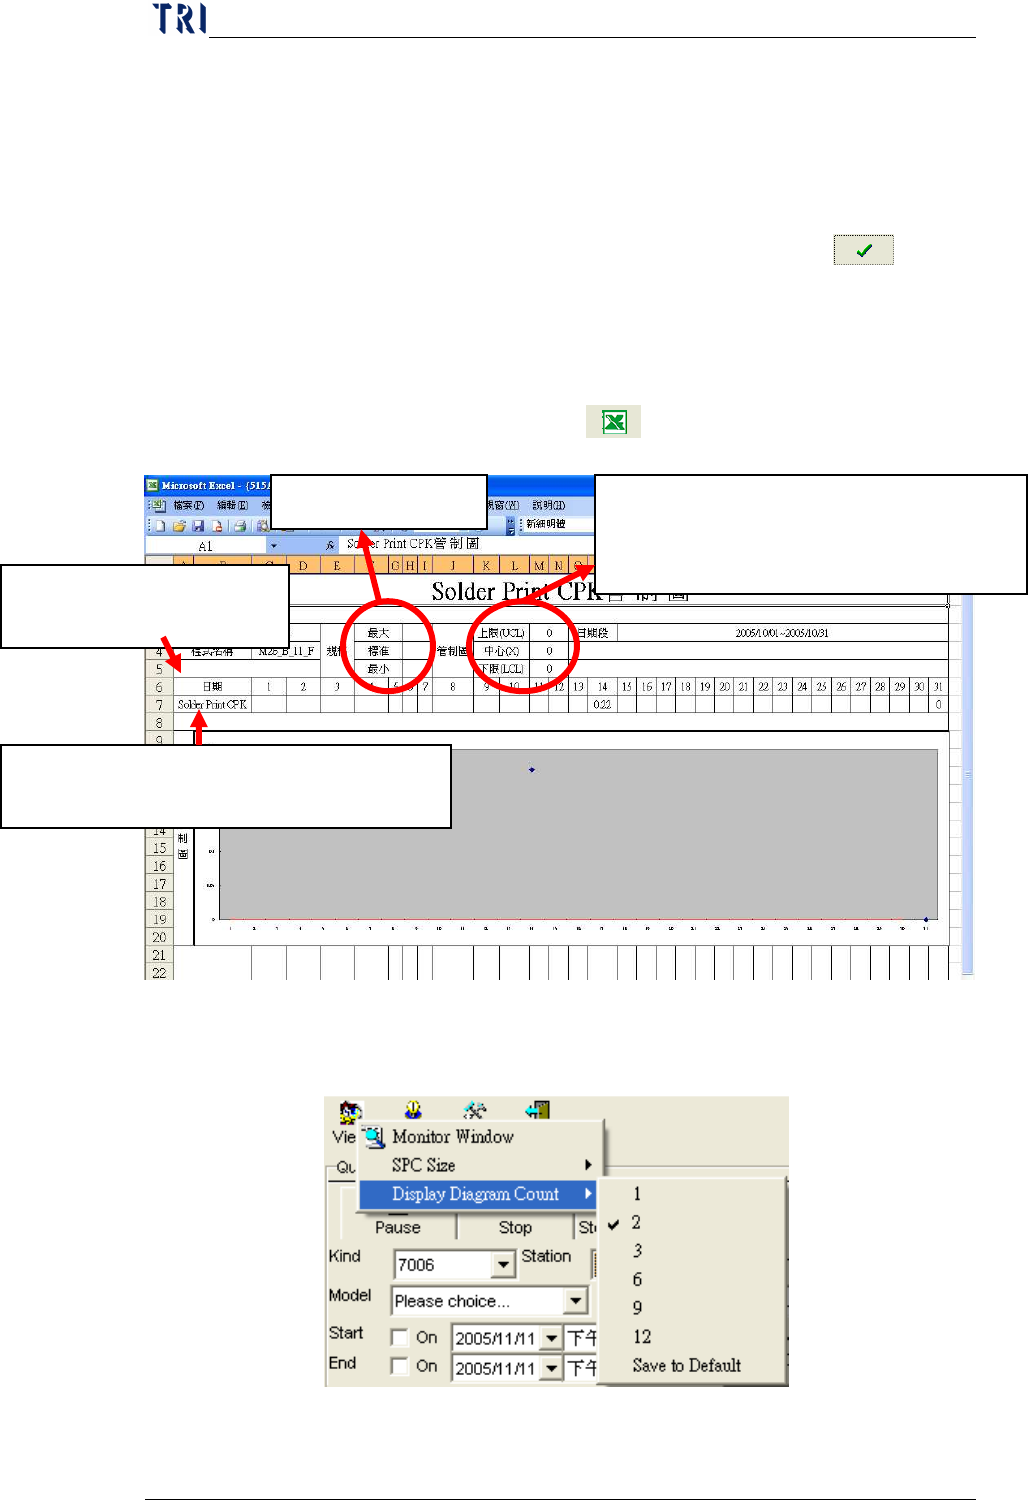
c. After all settings are completed, you can press “
” to
execute the query. The result will display in “Cpk Diagram”.
The Y axis means the Cpk data and X axis represents the
corresponding date.
d. Or you can press the “
” icon to export the Excel report.
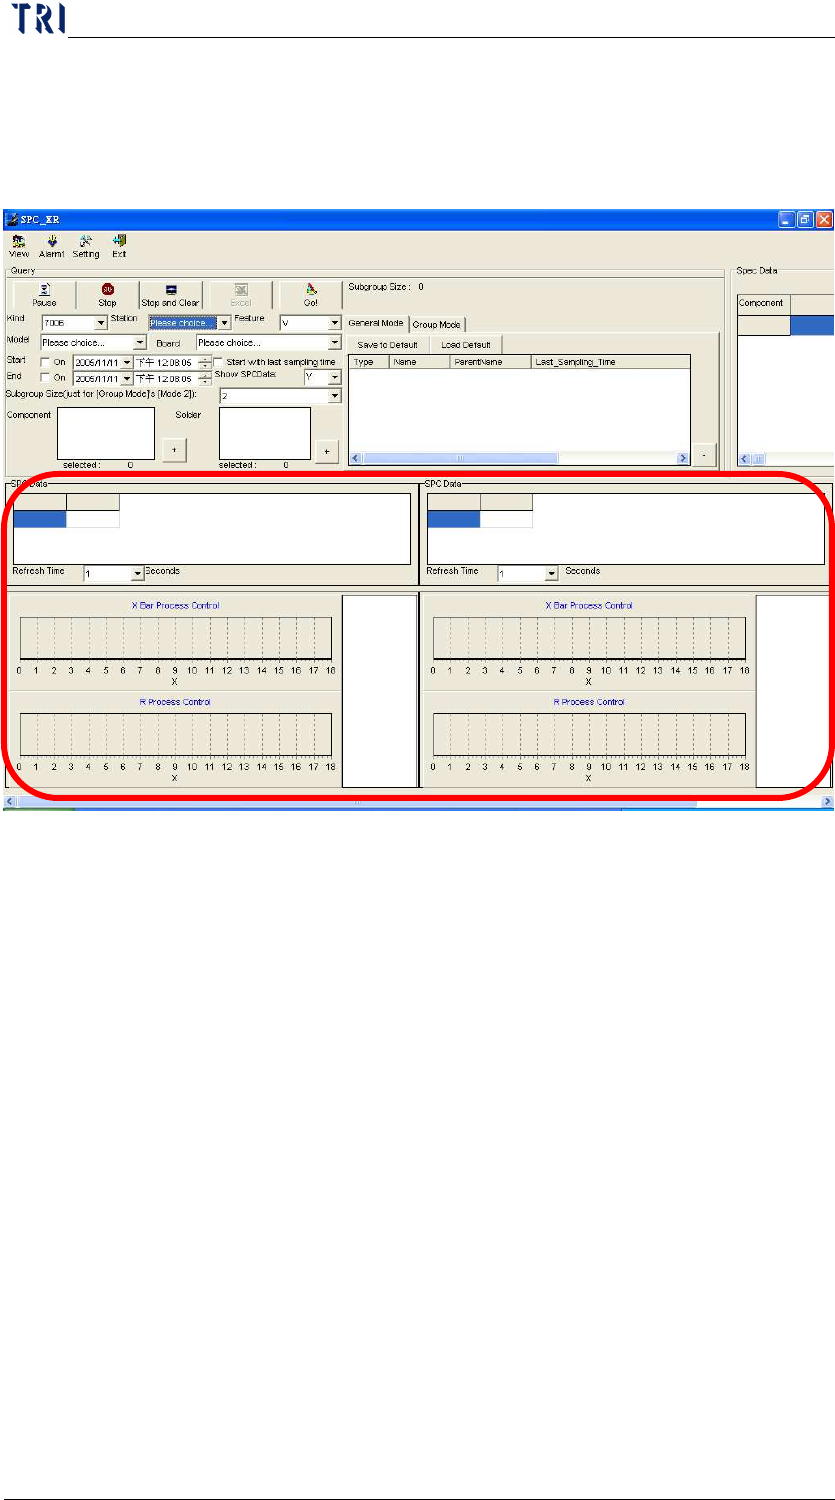
Display Diagram Count: The function is to set the number of
diagram you want to display in the real time monitoring section.
a. You can set 1, 2,3,6,9 or 12 diagrams to display. When you
Key in the spec manually, the default is
0. When you change the value, the spec
limits drawn below will be moved.
Key in Manually
Only display the day; for
example:
20
.
The Cpk value of that day, it has to be
linked to the latest Cpk data in daily report.
Chapter3 SPC User Manual
AOI Repair Station
105
finish the settings, you can press “Save to Default” to set the
setting as default. Take the above graph for example, when
you select 2, there are only 2 graphs displayed, as the
following picture.
7.3.1.2 Alarm: Functions under this category are relevant to “alarm data”.
Currently there are three functions: [Alarm Window], [Alarm Log]
and [Alarm League Table].
Alarm Window: shows logs of all alarms that occur during the
monitor process.
Alarm Log: shows logs of all alarms that have occurred.
Alarm League Table: Once you start running this software, the
system will count the number of alarms that occur in a Component
or Solder. As shown in the figure below, you can execute the
Alarm League Table function under Alarm to view the distribution
of the number of alarms for each Component or Solder as reference
in choosing the monitor items.