AOI_RS_v85_en - 第115页
Chap ter3 SPC User Ma nual AOI Repair Station 1 1 1 − − = − = ⇒ ⇒ = = = − = + = + + + = + + + = − = + + + = ⇒ ⇒ ⇒ σ σ σ σ ˆ 3 , ˆ 3 min ˆ 6 ˆ ) ( ) ( ) , , , min( ) , , , max( ) ( , , , 2 3 4 2 2 2 1 2 1 …
Chapter3 SPC User Manual
AOI Repair Station
110
select V (Volume), A (Area), H (Height), PX (X Shift) and PY
(Y Shift). If user select X, it means the X shift of the selected
component. The number of sample is according to the
sample size user set. For example, if the sample size is 5, it
displays X1, X2, X3, X4 and X5.
b. Average: Average. Add the all number in X1, X2, …, Xn field
together, then divide it by sample size. For example, if the
sample size is 5, the value will be (X1+X2+X3+X4+X5)/5.
c. R: Range. The maximum in X1~Xn subtract the minimum in
X1~Xn.
d. Ca: Process Accuracy. The formula is as the following.
Ca=((X bar-Spec Center)/(Spec Tolerance)/2)*100%
Spec Tolerance=USL-LSL
Spec Center=(USL-LSL)/2
e. Cp: Process Capability.
f. Cpk: Process Capability Index.
g. X-UCL: Upper Control Limit of X-bar chart.
h. X-Standard: Control Center Line of X-bar chart.
i. X-LCL: Lower Control Limit of X-bar chart.
j. R-UCL: Upper Control Limit of R chart.
k. R-Standard: Control Center Line of R chart.
l. R-LCL: Lower Control Limit of R chart.
m. Formula:
Chapter3 SPC User Manual
AOI Repair Station
111
−−
=
−
=
⇒
⇒
=
=
=
−=
+=
+++
=
+++
=
−=
+++
=
⇒
⇒
⇒
σσ
σ
σ
ˆ
3
,
ˆ
3
min
ˆ
6
ˆ
)(
)(
),,,min(),,,max(
)(
,,,
2
3
4
2
2
21
21
2121
21
21
XUSLLSLX
C
LSLUSL
C
LimitSpecLowerLSL
LimitSpecUpperUSL
d
R
RDLCL
RDUCL
ChartR
RAXLCL
RAXUCL
ChartX
k
RRR
R
k
XXX
X
XXXXXXR
n
XXX
X
countsubgroupk
sampleXXX
sizesamplen
pk
p
R
R
X
X
n
k
nn
n
n
L
L
LL
L
L
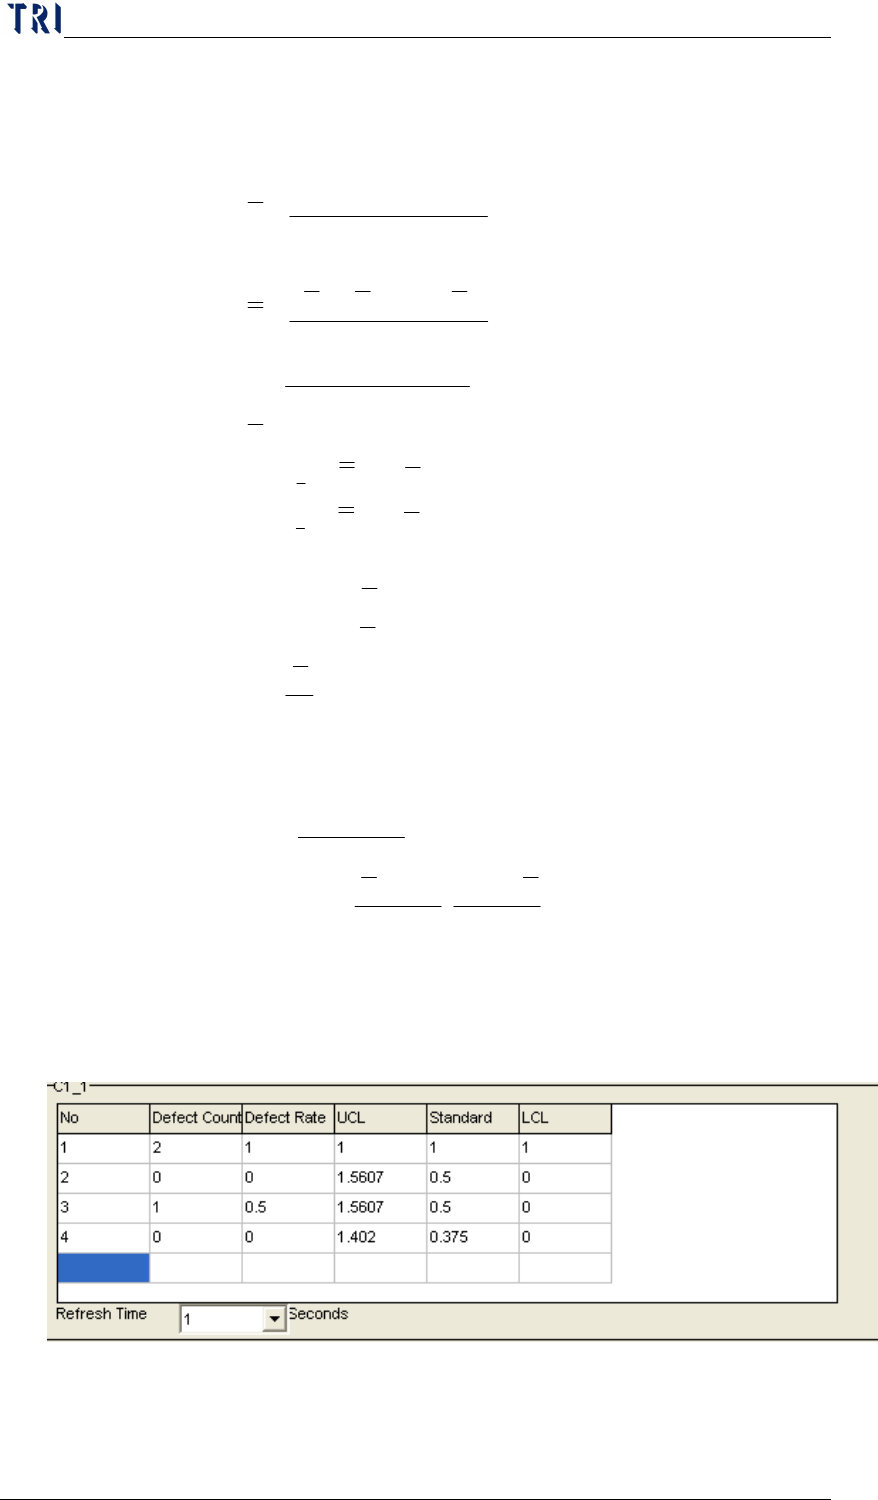
P Chart: If a user selects P Chart, the statistic data are as the
followings.
Every fields are explained below:
a. Defect Count: Total defect count.
Chapter3 SPC User Manual
AOI Repair Station
112
b. Defect Rate: The formula is:
Defect Rate=Defect Count/Subgroup Size
c. Subgroup Size: Sample size
d. UCL: Upper Control Limit of P chart.
e. Standard: Control Central Line of P chart.
f. LCL: Lower Control Limit of P chart.
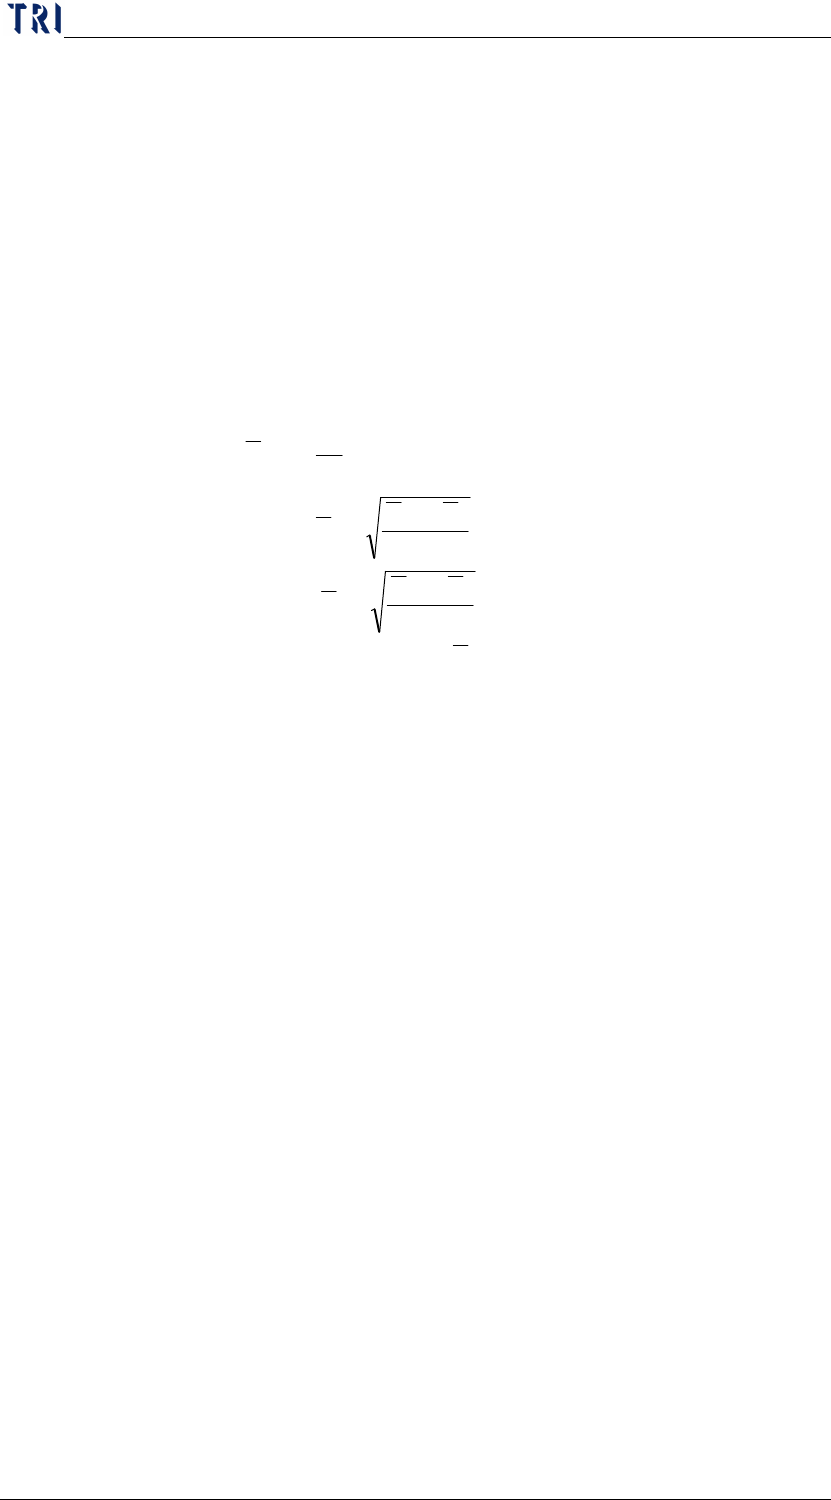
g. Formula
P
Line
Central
Control
n
PP
PLCL
n
PP
PUCL
m
p
P
ratedefectsamplesp
samplingpersizesamplem
smplingofsetameansgroupasizegroupn
m
i
i
i
)1(
3
)1(
3
,
) (
1
−
−=
−
+=
=
⇒
⇒
⇒
∑
=