AOI_RS_v85_en - 第150页
Chap ter3 SPC User Ma nual AOI Repair Station 146 S tyle 3 Report 3. 儲存成功訊息 ! 1. Click on [Excel] and select Sty le 3 2. Report Parameters Setting Select t he data that us er wants to output besides statistic data and …
Chapter3 SPC User Manual
AOI Repair Station
145
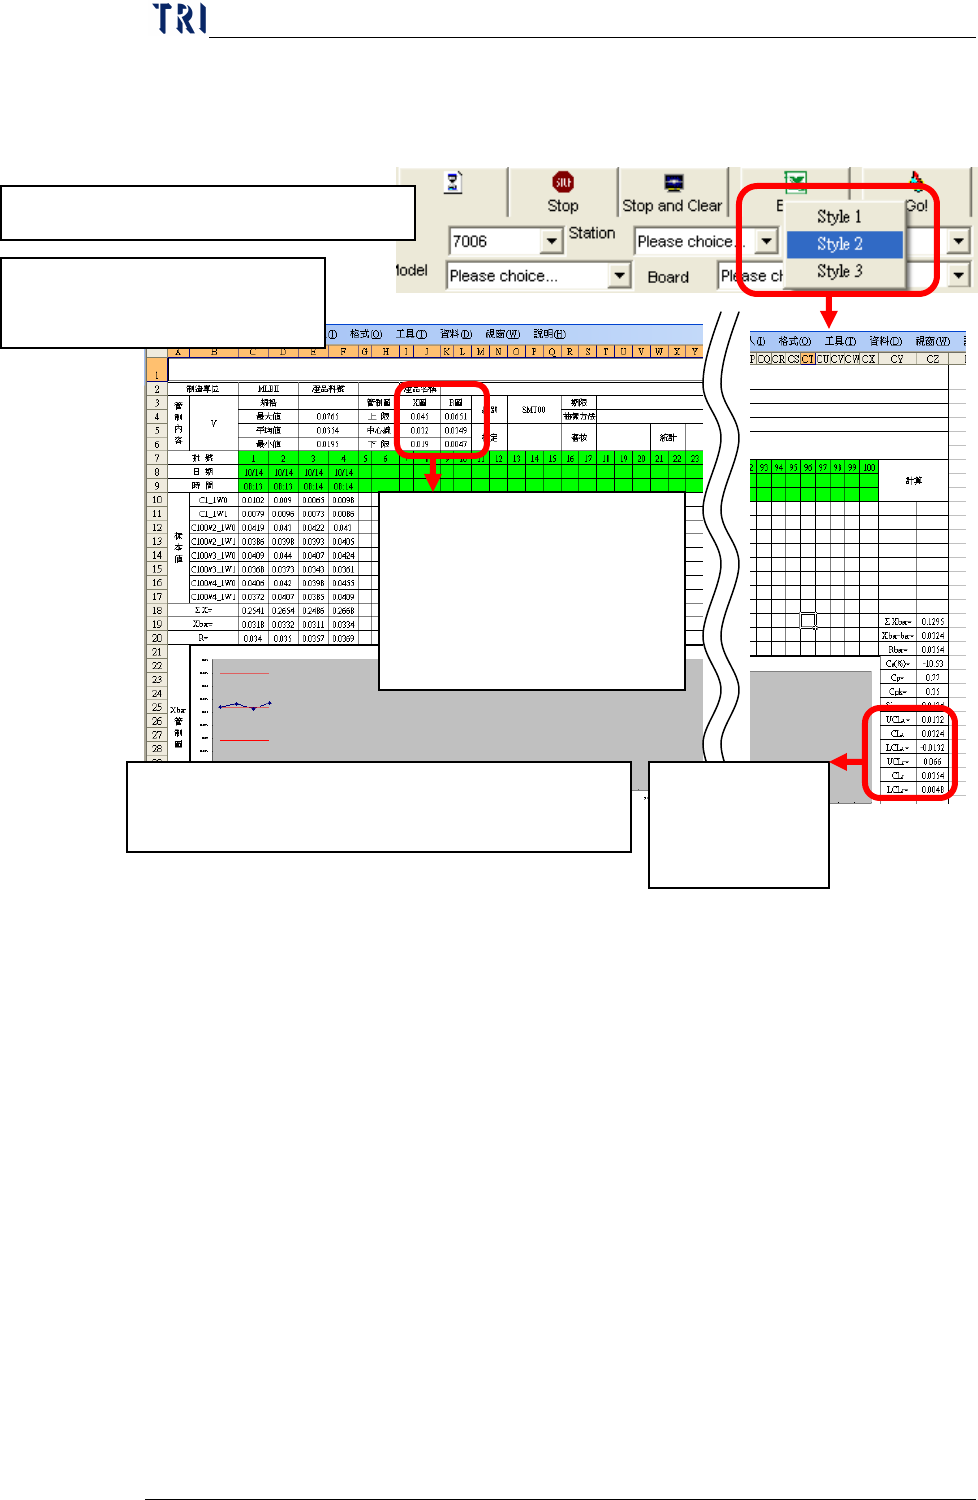
Style 2 Report: This kind report is only for [Mode2] under
[Group Mode].
1. Click on Excel and select Style 2
2. Review Excel file: A Sheet
only displays data for a group.
The control limits last week. If
this is data first week, for X bar
Chart we use the Spec Data and
for R Chart we use 0 to be the
control limits.
The control limits
this week up to
present.
P.S. If you change a sample data in this report, the relating
statistic data and control chart will be changed.
Chapter3 SPC User Manual
AOI Repair Station
146
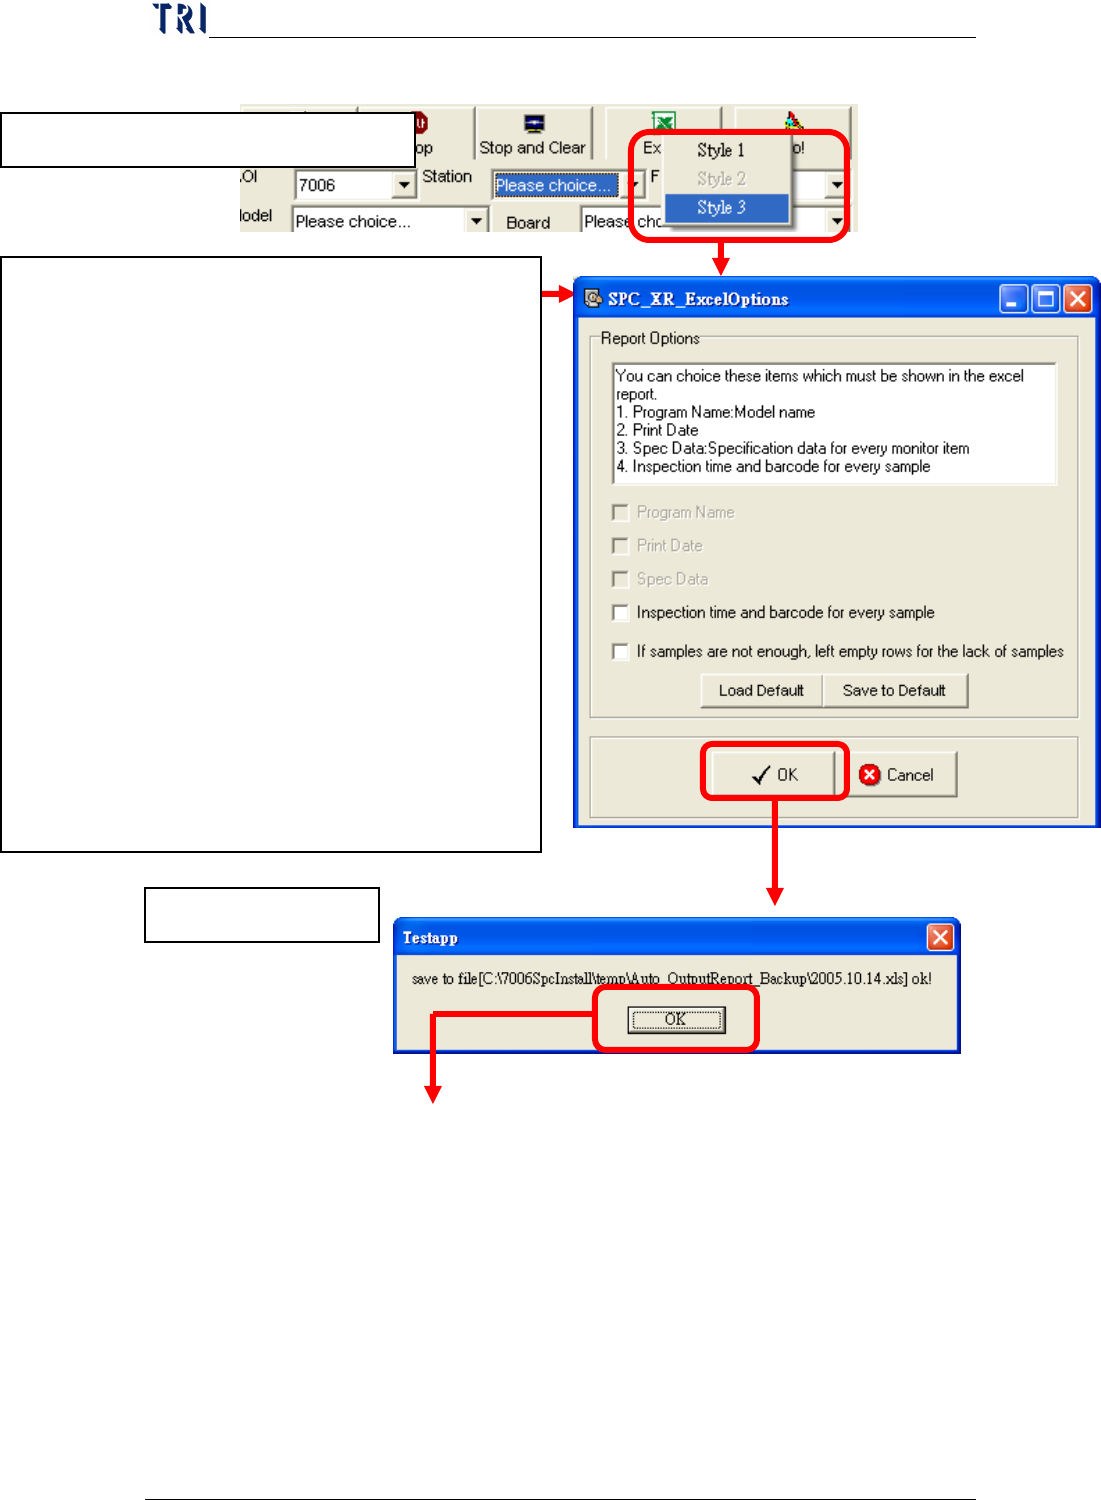
Style 3 Report
3.儲存成功訊息!
1. Click on [Excel] and select Style 3
2. Report Parameters Setting
Select the data that user wants to output besides
statistic data and control chart in Excel file. User
can select:
Program Name
Print Date
Spec Data
Inspection time and barcode for every sample:
the inspection time and barcode for the board
that every sample belongs to.
If samples are not enough, left empty rows for
the lack of samples: When the samples are not
enough, there are empty rows left for user to
key in manually. The number of samples is
time period divided by interval.
Chapter3 SPC User Manual
AOI Repair Station
147
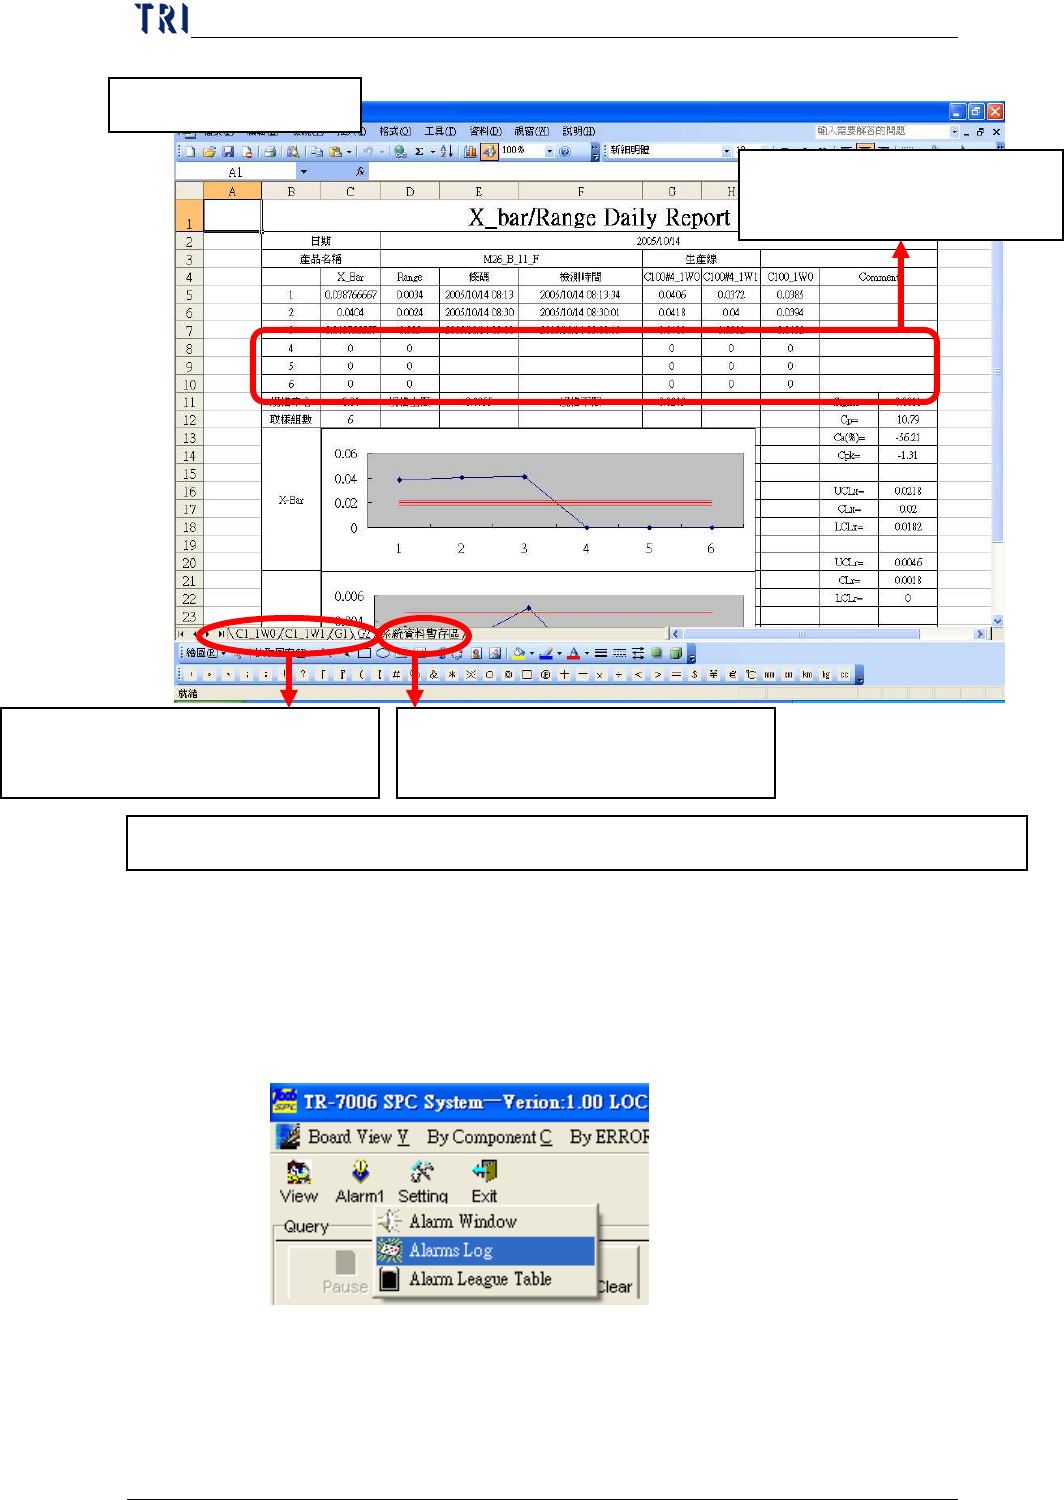
In addition, you can query the Alarms Log. When an alarm (error)
occurs, the system will save a record in the Alarms Log. From the
Main menu, you can click on “
Alarm” and then “Alarms Log” to
display the Alarm Log window as shown below.
4. Review Excel Data
P.S. If you change a sample data in this report, the relating statistic data and control chart will be changed.
A monitored item uses a sheet to
output data.
The last Sheet is the temporary
zone, don’t delete it.
These rows are reserved for
user to key in data manually.