TR7500_Series_Software_v29_En - 第125页
Test Research Inc. TR7500 Series User Guide – Software v.2.9.0 103 Name Component Name Theta_CpkS pec CpkSpec for Theta Theta_Cpk Cpk for Theta Missing The number of missin g . X_Position The result of X coordina te on C…
Test Research Inc.
102 TR7500 Series User Guide –Software v.2.9.0
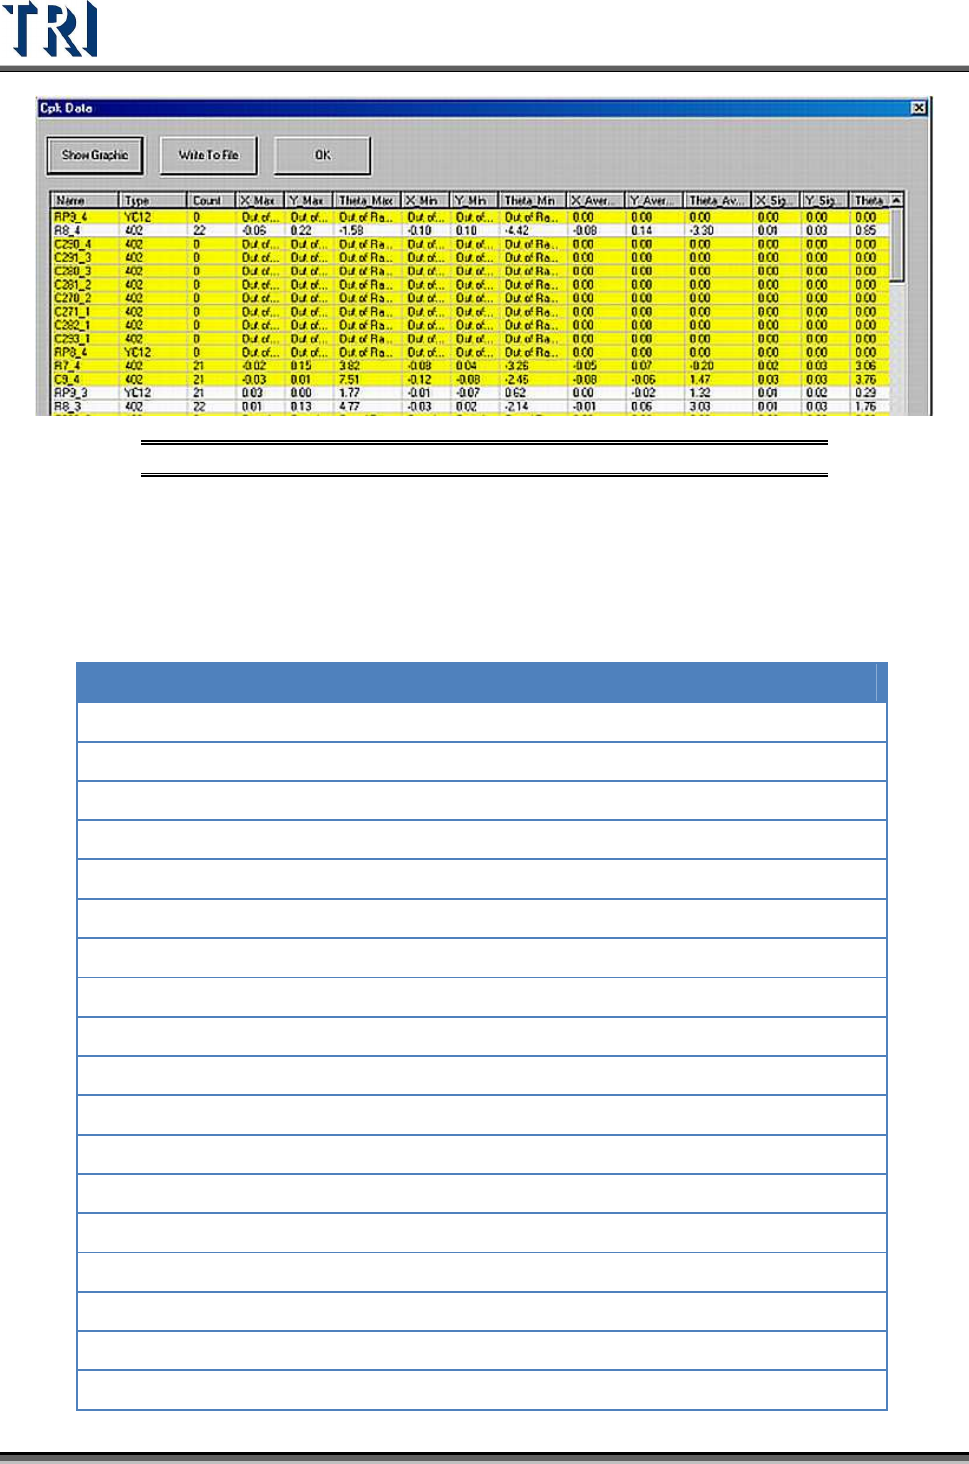
Figure 169: Cpk Data Table
Clicking on a field title will sequence the data according to that value.
The yellow means that the component is ‘abnormal’: The Cpk Value is lower than
CpkSpc.
Each field is explained in the table below:
Name Component Name
Type
Component type
Count
The number of data calculated.
X_Max
The maximum for X-shift (unit: mm)
Y_Max
The maximum for Y-shift (unit: mm)
Theta_Max
The maximum for Theta (unit: mm)
X_Min
The minimum for X-shift (unit: mm)
Y_Min
The minimum for Y-shift (unit: mm)
Theta_Min
The minimum for Theta (unit: mm)
X_Average
The average for X-shift (unit: mm)
Y_Average
The average for Y-shift (unit: mm)
Theta_Average
The average for Theta (unit: mm)
X_Sigma
The sigma for X-shift (unit: mm)
Y_Sigma
The sigma for Y-shift (unit: mm)
Theta_Sigma
The sigma for Theta (unit: mm)
X_CpkSpec
CpkSpec for X-shift
X_Cpk
Cpk for X-shift
Y_CpkSpec
CpkSpec for Y-shift
Y_Cpk
Cpk for Y-shift
Test Research Inc.
TR7500 Series User Guide –Software v.2.9.0 103
Name Component Name
Theta_CpkSpec
CpkSpec for Theta
Theta_Cpk
Cpk for Theta
Missing
The number of missing.
X_Position
The result of X coordinate on CAD adds the average of X-
shift
Y_Position
The result of Y coordinate on CAD adds the average of Y-
shift
Status
It shows [NG] and displays yellow symbol when there’s a
[Missing] or [Cpk<CpkSpec]. Otherwise it shows [OK].
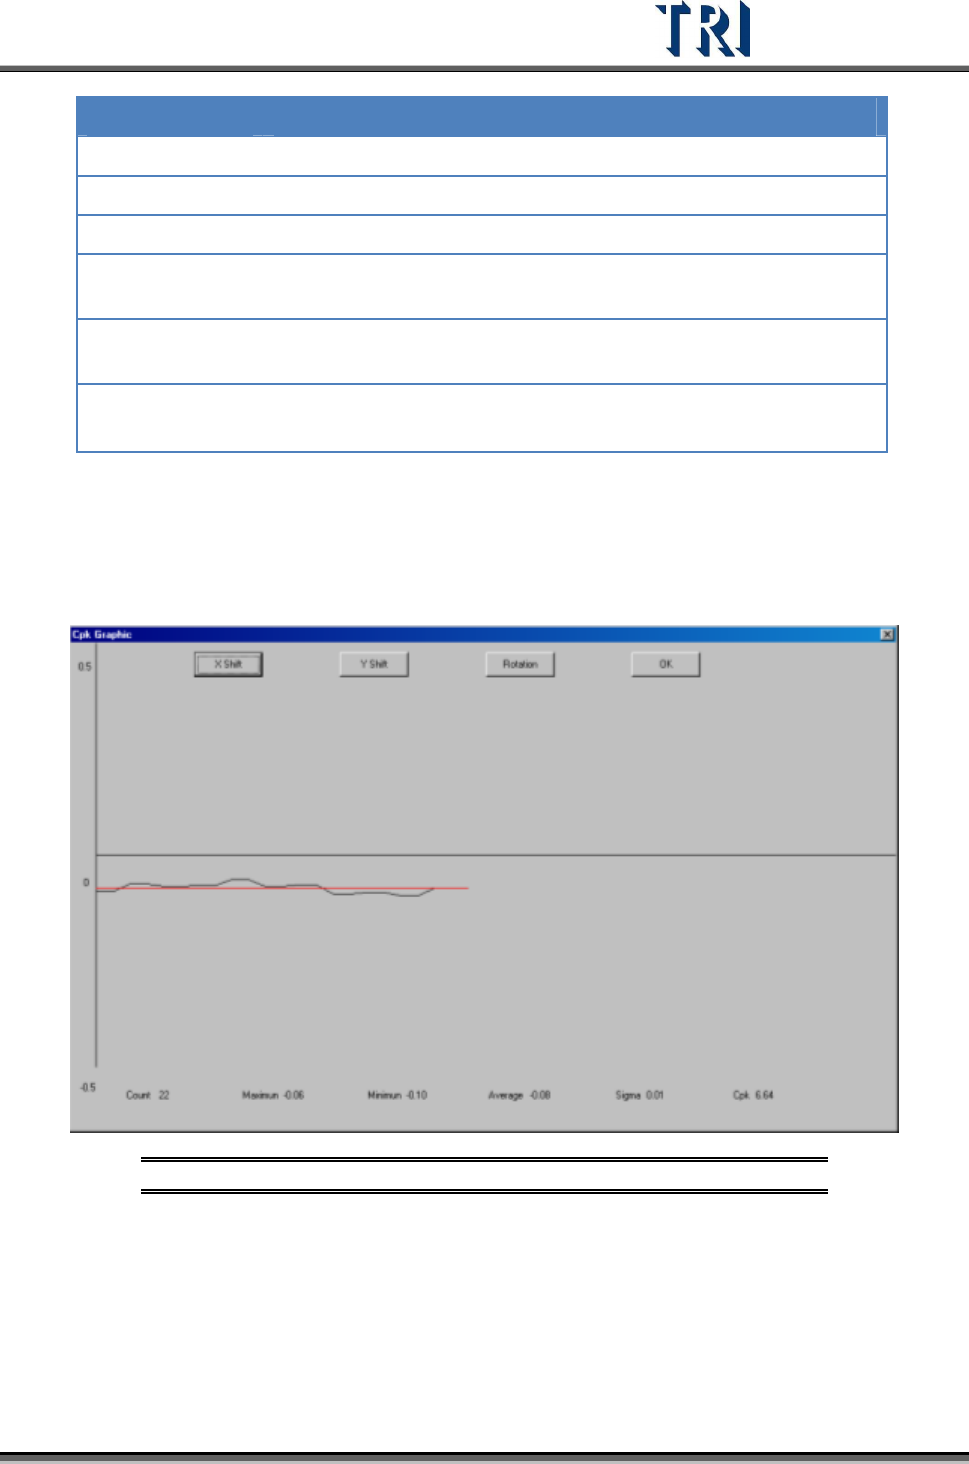
[Show Graphic] – Show the time sequence graph for selected component.
Select to display the graph of X-shift, Y-shift or Rotation.
The horizontal axis presents the count and the vertical means the result.
The red line means the average.
Figure 170: Time Sequence Graph
[Write To File] – Output the original data as text file.
[OK] – Close the window.
Test Research Inc.
104 TR7500 Series User Guide –Software v.2.9.0
Formula
i
X=
Result
n
=
countTest
n
X
∑
==
i
X
Average
1
)(
Sigma
2
−
−
==
∑
n
XX
i
σ
−−
=
σσ
3
)(
,
3
)( LSLXXUSL
MinC
pk
USL and LSL present the upper spec limit and lower spec limit. Set the value when
starting this function.
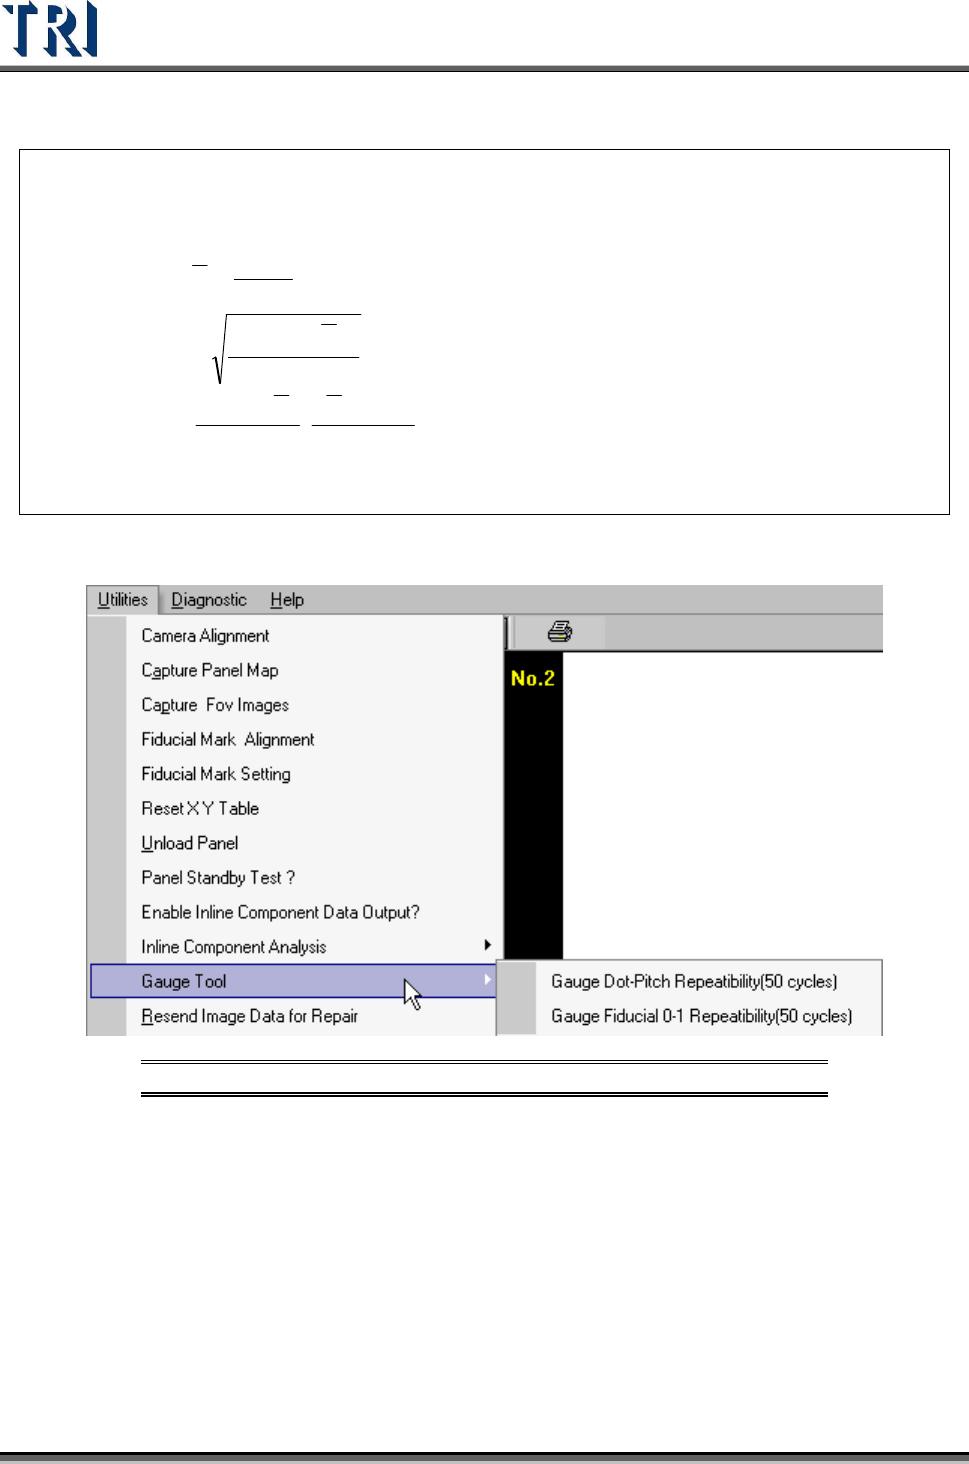
3.10.11 Gauge Tool
Figure 171: Utilities Tab -- Gauge Tool Options
3.10.11.1 Gauge Fiducial 0-1 Repeatability (50 cycles)
System will measure the distance between two fiducial marks for 50 times and output the
result in [C:\AOI] folder. The first measurement file name is [fireport1.txt] and the next files
will be [fireport2.txt], [fireport3.txt] and so on. Select YES for static or NO for board in and out
test.