FCM_User Reference Manual.pdf.pdf - 第119页
4022 591 96082 User Re ference Manual 02.02 FCM Multiflex 5-27 MIS 5.3.2.5 [ R eports] > [Pr oce ss gr aph...] T ABL E 5-12 Qui ck Refer ence fcm05 27a.tif SCREE N 5-2 2 [Proc ess g r aph. ..] screen e xample Actions …
MIS
User Reference Manual 4022 591 96082
5-26 FCM Multiflex 02.02
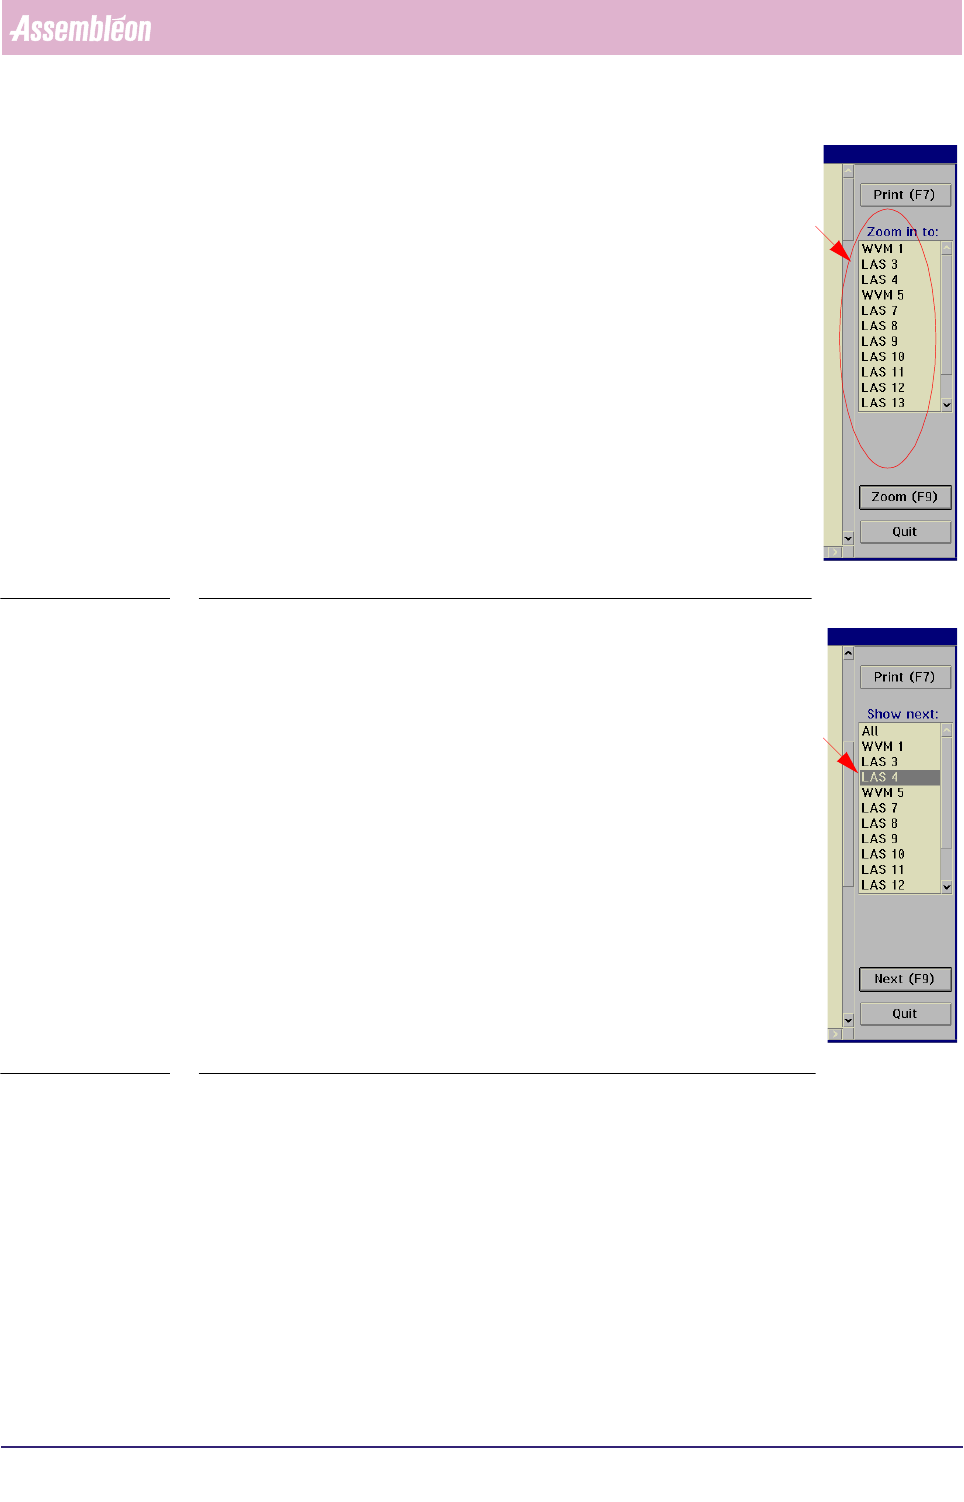
▼ Controls
The controls on the right of the [Process report...] screen have the
following functions:
■ select
[Print (F7)] or press <F7> to print the report
■ to take a closer look to a specific module, select a module
from the listbox
■ select
[Zoom (F9)] or press <F9>
This will display the process report of the selected module, in
which detailed process information is shown
SCREEN 5-20
■ to switch to the process report of another module,
• either select [Next (F9)] or press <F9>
This will display the process report of the placement module
that was marked in the listbox before. Each time a [Next
(F9)]
command is given (or <F9> is pressed, next item from
the listbox will be marked.
• or directly select the module you want from the listbox and
then select
[Next (F9)] or press <F9> to display its process
report
■ select
[Print (F7)] or press <F7> to print the report
■ select
[All] in order to go back to the overall process report
■ select
[Quit] to go back to the [MIS] > [Functions...] menu
SCREEN 5-21
4022 591 96082 User Reference Manual
02.02 FCM Multiflex 5-27
MIS
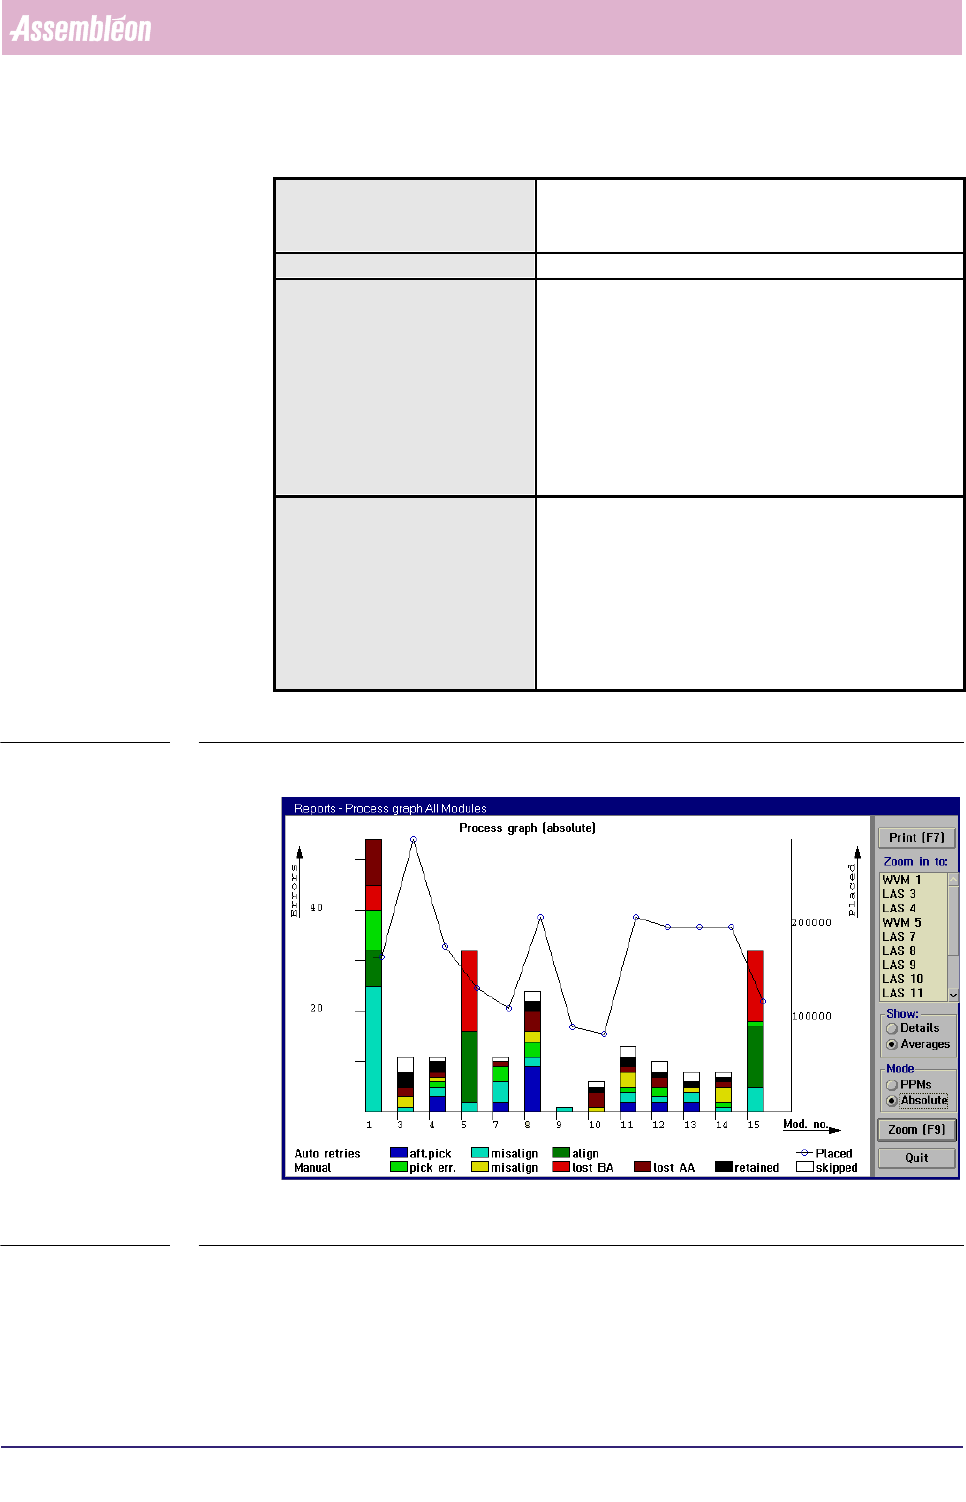
5.3.2.5 [Reports] > [Process graph...]
TABLE 5-12 Quick Reference
fcm0527a.tif
SCREEN 5-22 [Process graph...] screen example
Actions ■ select [Functions...] in the MIS pull-down menu
■ select [Reports]
■ select [Process graph...]
Conditions ■ order active
Information ■ number of auto retries per placement module + per
feeder
■ number of manual retries per placement module +
per feeder
■ number of placed SMDs per placement module + per
feeder
■ number of not placed SMDs (skipped) per placement
module + per feeder
■ misalign details per placement module + per feeder
Display Options ■ process graph for all modules
• averages = errors per placement module
• details = errors per feeder
■ process graph per placement module (zoom-in
function)
• all errors
• misalign errors
■ errors in PPMs or absolute
MIS
User Reference Manual 4022 591 96082
5-28 FCM Multiflex 02.02
✱✱Detailed Information
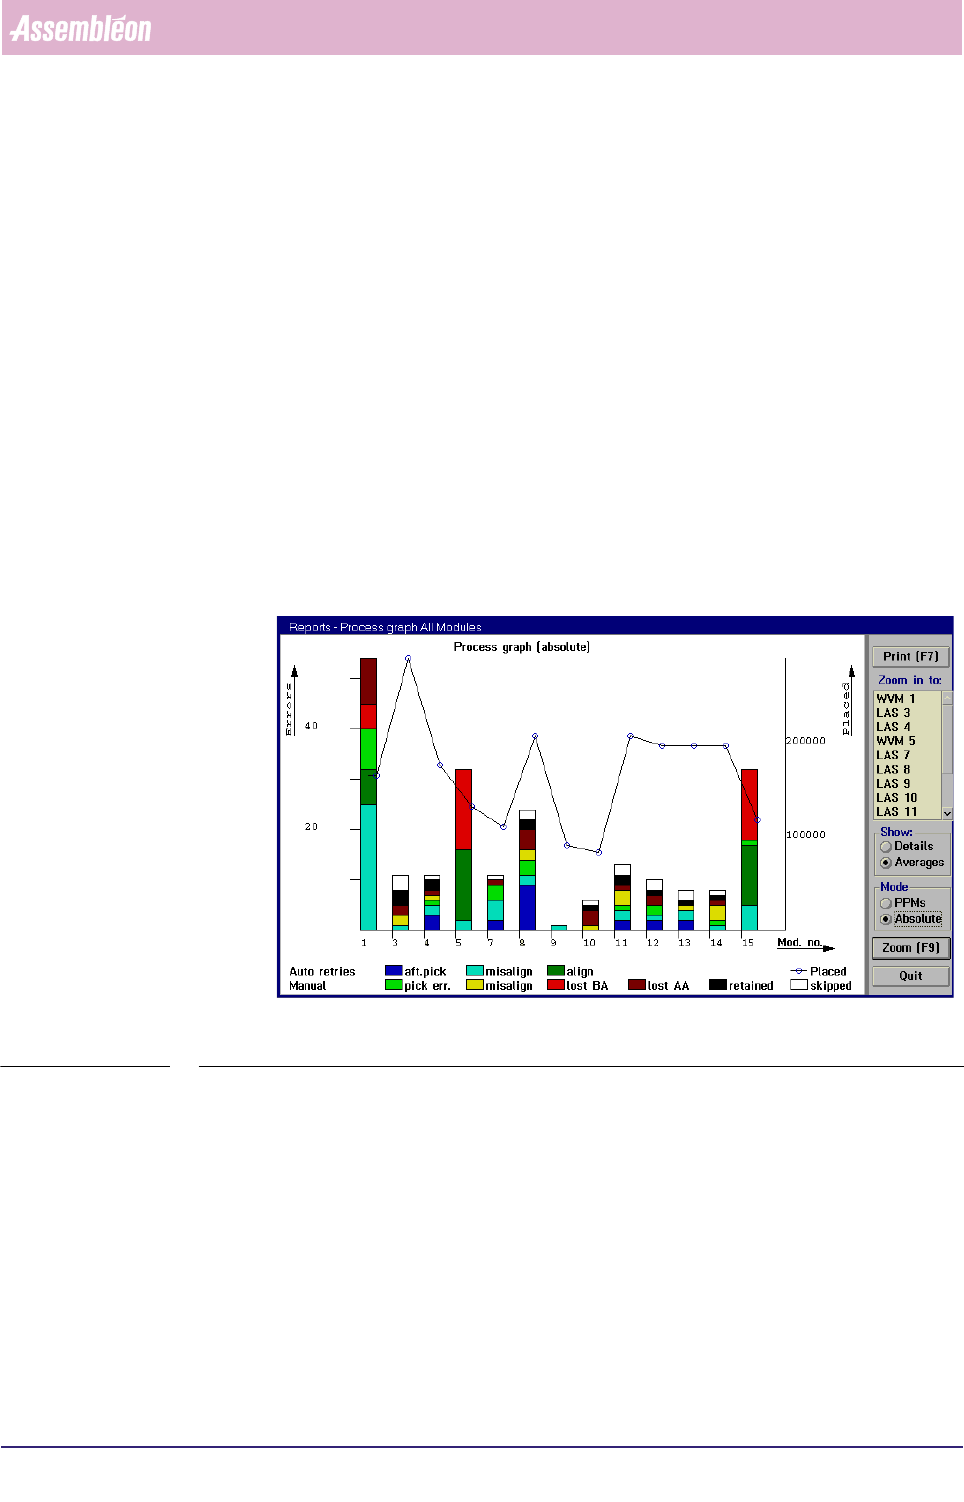
▼ Displayed Information
The [Process graph...] report gives a graphical overview of the process errors.
They can either be displayed for all placement modules or for a specific
placement module.
■ The process errors are displayed in bar-graphs, that have different colours for
each process error type. The amount of errors can be read from the left Y-axis.
This can either be in absolute numbers or in PPMs, depending on the selected
mode.
■ The number of placed SMDs are displayed in a line-graph. The amount
ofplaced SMDs can be read from the right Y-axis.
■ The placement module position or the feeder position can be read from the
X-axis, depending on the selected mode.
On first entry, the report displays an overview on all (used) placement modules (see
SCREEN 5-23).
fcm0527a.tif
SCREEN 5-23 [Process graph...] All modules screen example