VI User Manual.pdf - 第314页
Production 11 - 14 Vision 2007 4.10 User Manual Re v 01 Display the list of the ana- l y z e d v a r i a b l e s . T h e c h a r t s c o r - respond to the selected variable. 11.3.2.2 SPC charts display area 4 charts whi…
Production
Vision 2007 4.10 User Manual Rev 01 11 - 13
11.3.2 SPC option in production screen
A SPC toobar.
B SPC charts display area.
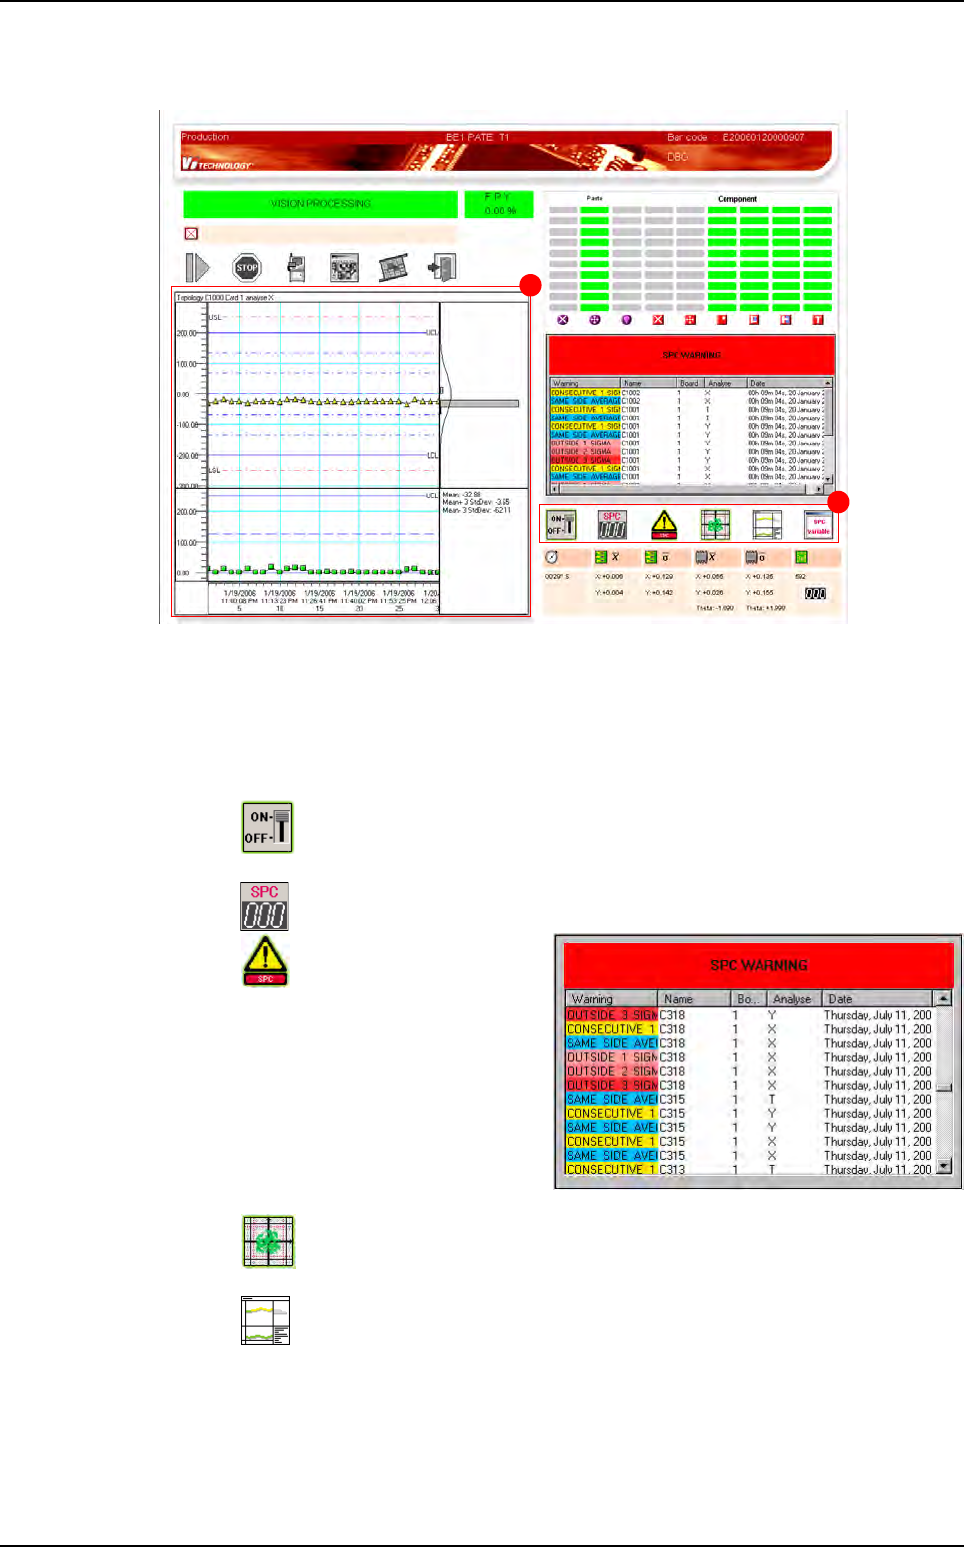
11.3.2.1 SPC toolbar
Function of each button:
Activate/deactivate the analysis. The user can come back to the classical
Production screen.
Reset the analysis.
Display the list of the warn-
ings found. The red button
SPC WARNING allows to clear it.
The charts correspond to the se-
lected warning.
Display the curves or the group of dots.
Select the graphs type to display.
B
A
Embedded SPC
Production
11 - 14 Vision 2007 4.10 User Manual Rev 01
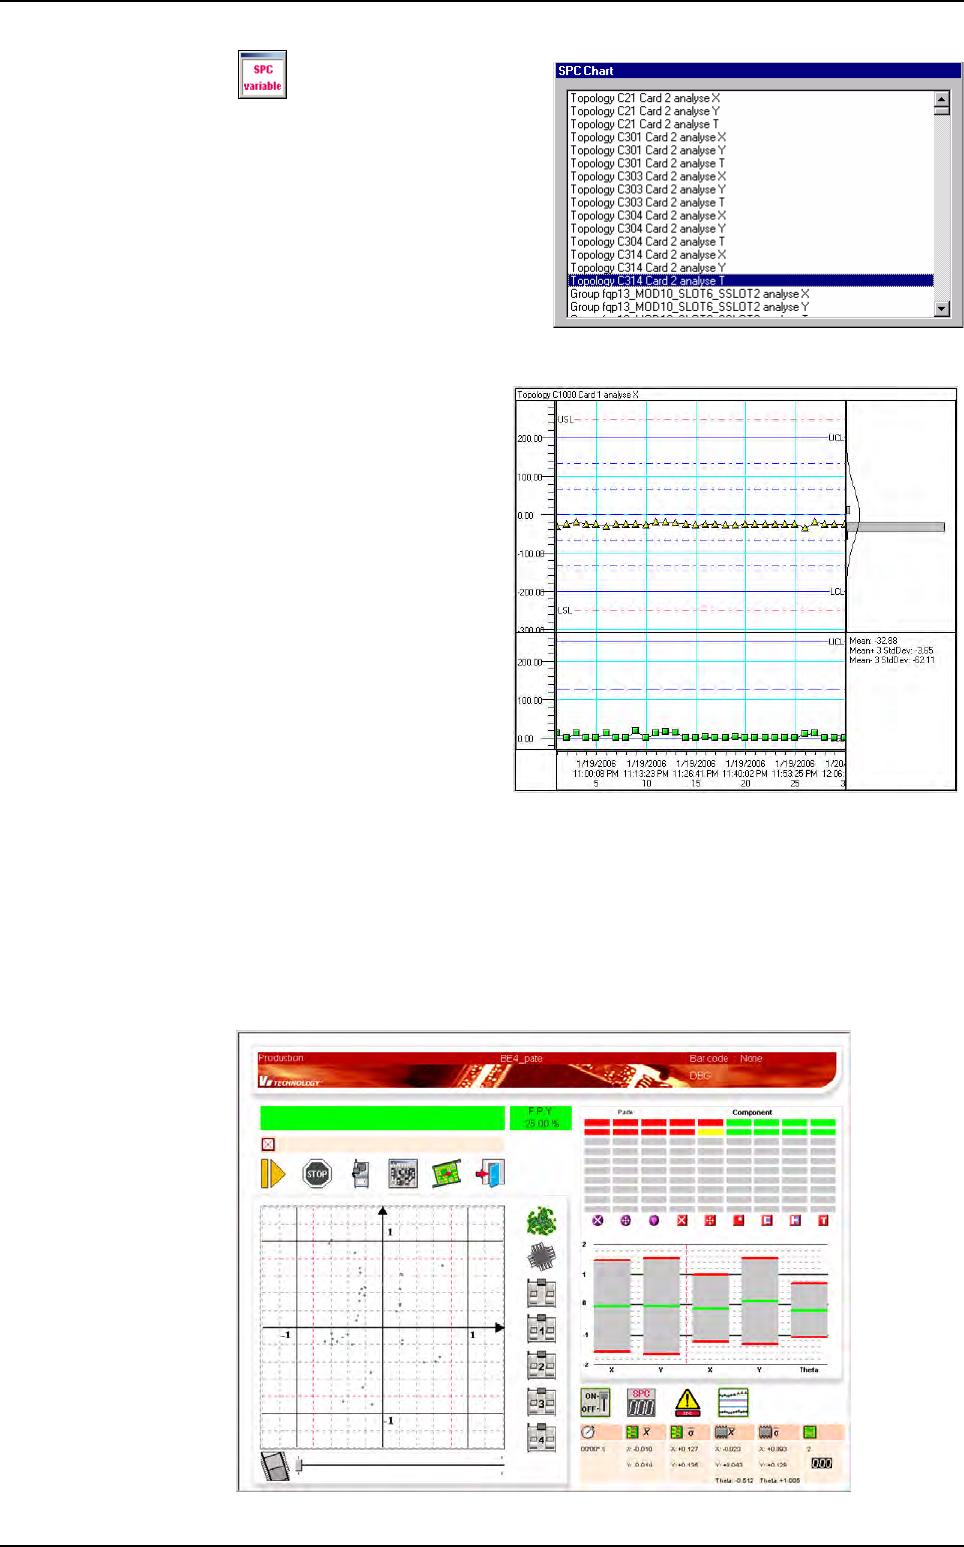
Display the list of the ana-
lyzed variables. The charts cor-
respond to the selected variable.
11.3.2.2 SPC charts display area
4 charts which shows the
SPC values (and warnings):
Chart X: SPC variable values
(and warnings).
Chart S: sigma values of the
data which compose each
SPC point.
Chart H: histogram which
presents the distribution of the
SPC values.
Chart T: different statistical
values concerning the select-
ed point.
LSL and USL: Lower and Up-
per Specification Limits corre-
spond to the classical tolerances. When a measured value is outside these values,
it is considered as a defect.
LCL and UCL: Lower and Upper Control Limits correspond to 80% of LSL and USL.
SPC charts display area
11.3.2.3 SPC running in production mode
When the production mode is launched, the screen below is displayed, with the
SPC button visible.
Embedded SPC
Production
Vision 2007 4.10 User Manual Rev 01 11 - 15
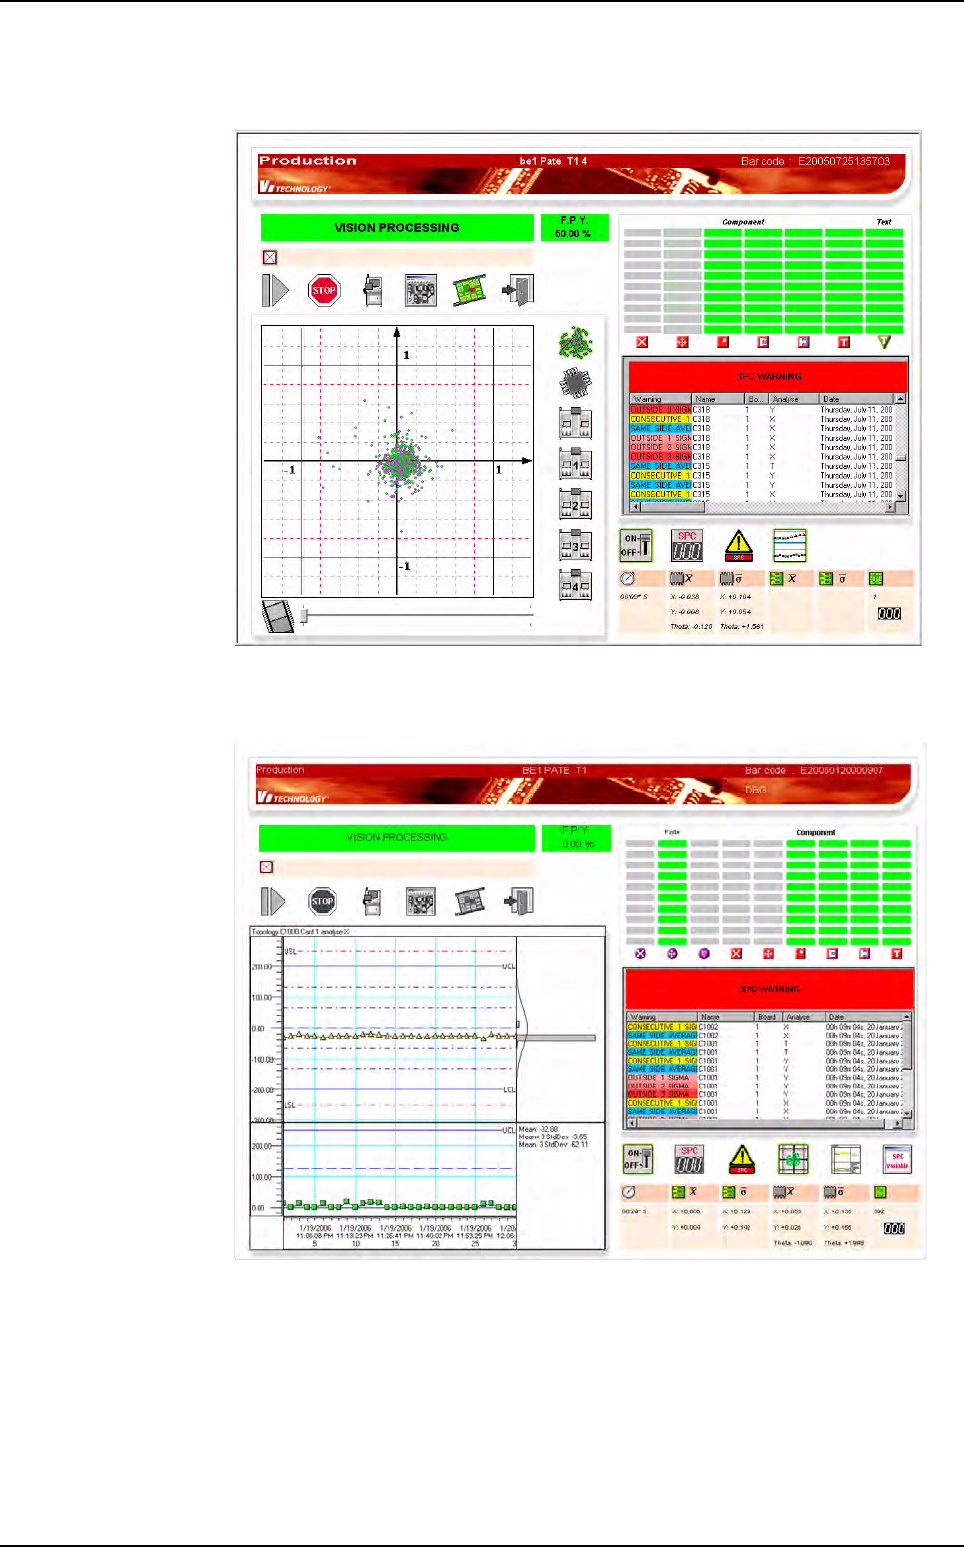
When the SPC engine compute 1 SPC WARNING, the warning dialog box is auto-
matically displayed.
When you click on a
SPC WARNING
, it display the corresponding chart:
Embedded SPC