VI User Manual.pdf - 第327页
Optimization Vision 2007 4.10 User Manua l Rev 01 12 - 9 Only the upgraded Jedecs will be imported in the library. For each upgraded Jedec, all the modified paramete rs will be imported. The lin ks arrangement will be mo…
Optimization
12 - 8 Vision 2007 4.10 User Manual Rev 01
12.1.2.8 Optimization results
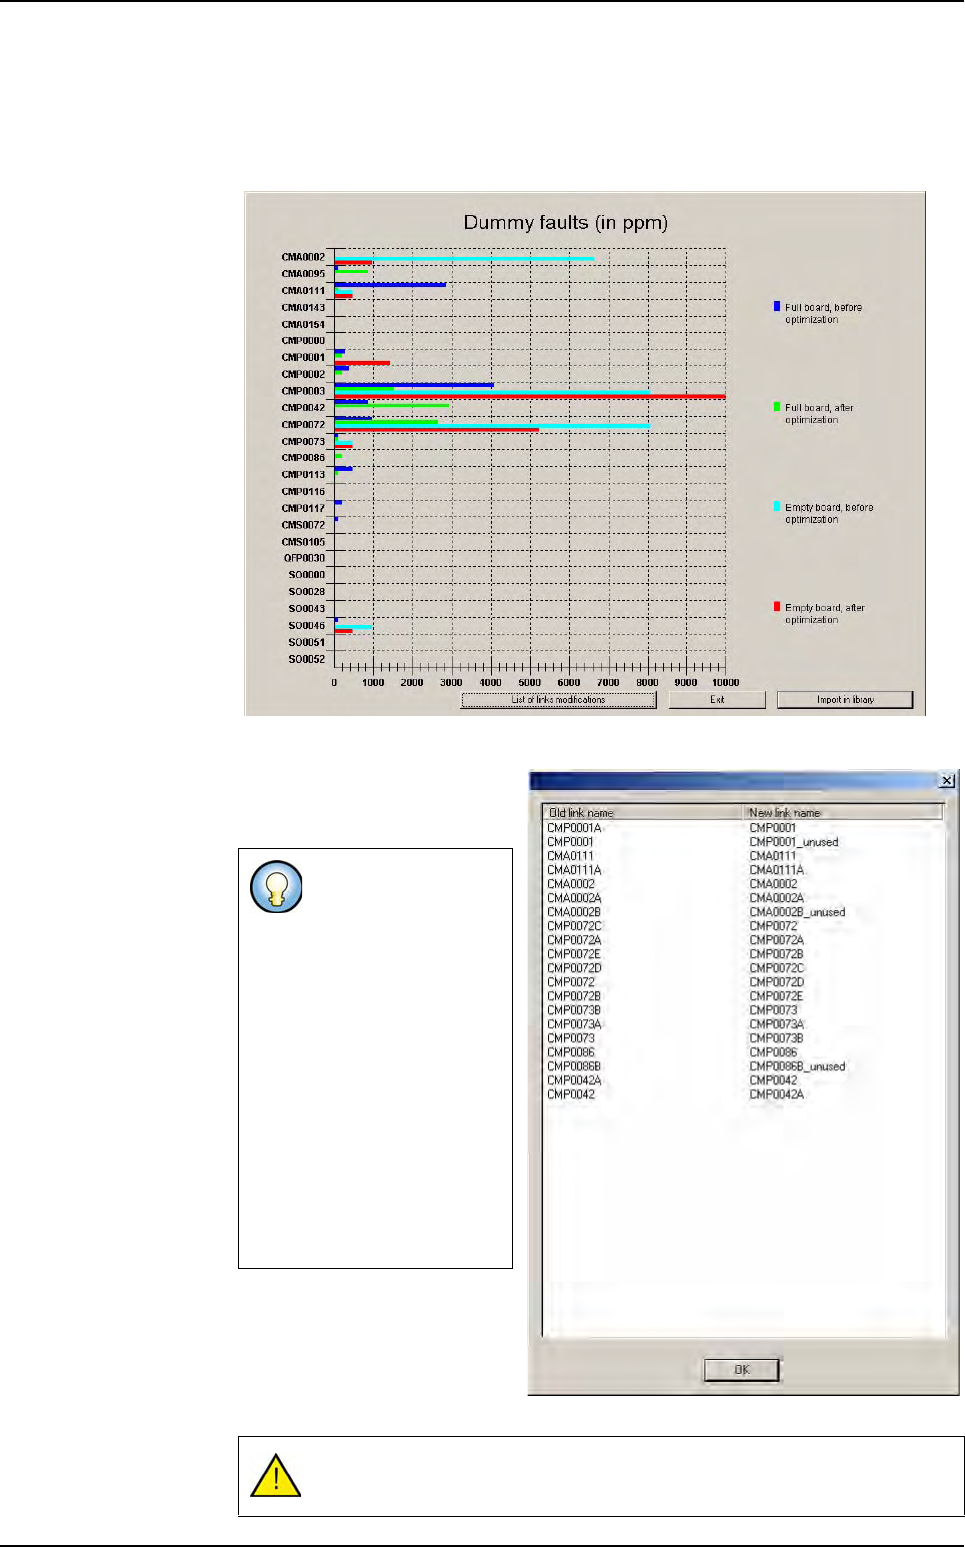
This graph represents the false faults (in PPM) before and after optimization for
each Jedec on full and empty panels. It makes the AFT results easy to visualize,
independently of all the modified parameters.
The
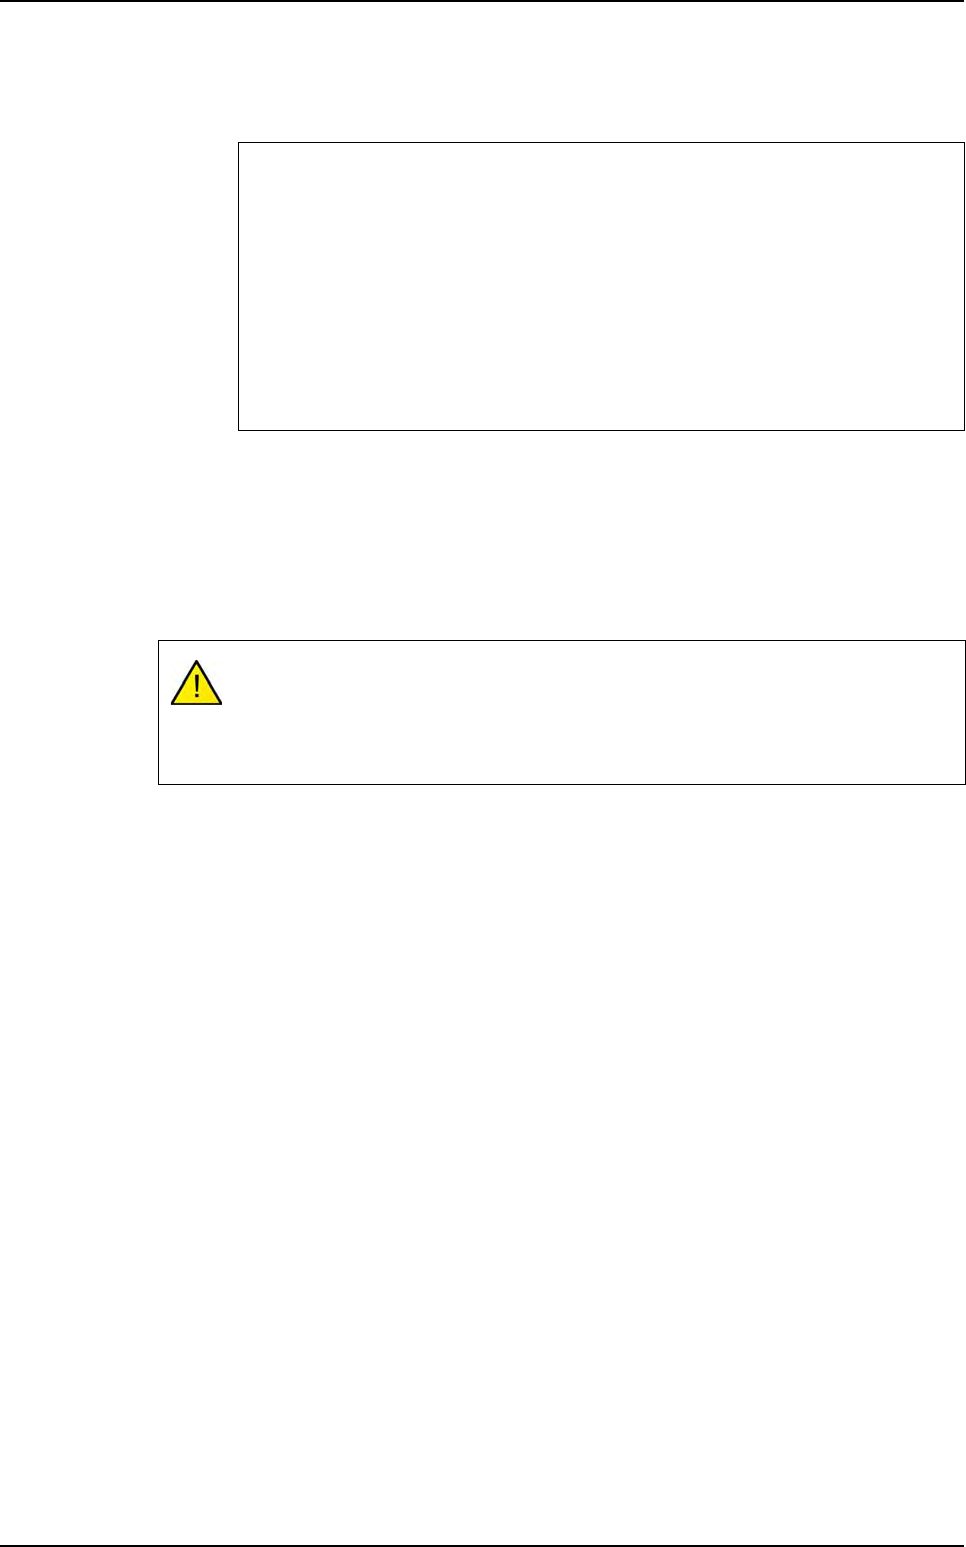
List of link modifications
button opens a box that lists the
Jedecs that have links.
The Exit button closes the AFT
Wizard without modifying the li-
brary.
The
Import in library
button
imports the results in the library.
The link optimization
permutes the links and
renames them so that
in the optimized library
the links are:
ROOT001,
ROOT001A,
ROOT001B, …
This list contains the
old name and the new
name of each model
(link).
The links that will be
deleted are renamed
with _unused.
The library will be saved with the optimized parameters.
Auto Fine Tune (AFT)
Optimization
Vision 2007 4.10 User Manual Rev 01 12 - 9
Only the upgraded Jedecs will be imported in the library. For each upgraded Jedec,
all the modified parameters will be imported. The links arrangement will be modi-
fied, and the unused links will be deleted.
12.1.3 AFT panel player
Auto Fine Tune enables running recorded panels in process mode (for example on an offline
station). To record panels, please consult the AFT Recording and optimization wizard.
With the .tst file window active, select the Play option from the AFT menu. This will open the
AFT player toolbar.
Select the panel you wish to run in the scroll list and press the LOAD button. The AFT record
is read from the hard drive. Now you can run the panel in debug mode (step by step, contin-
uous, Ctrl E, Ctrl B).
You can modify the .tst file as long as you do not modify the zones and fiducials.
You can change the attached library and anything in the library (except the light levels).
A Jedec is considered as upgraded when:
The number of false faults is lower (or equal) after optimization than it was
before (on both empty and full panels).
The number of false faults is greater than before on empty panels and lower
on full panels, but the overall increase in false faults for this Jedec is lower than
the criterion.
The number of false faults is lower than before on empty panels and greater
on full panels, but the overall increase in false faults for this Jedec is lower than
the criterion.
To run a .tst file on recorded panels, you will need the same .tst file that was used
for recording the panels (same fiducials and zones).
Open this .tst file, and make sure the path to the records is correct (.tst file
configuration, AFT tab).
Auto Fine Tune (AFT)
Optimization
12 - 10 Vision 2007 4.10 User Manual Rev 01
12.2 Production debug tool
Fine tuning a library may be a laborious task when the false calls rate is quite low, because it be-
comes difficult to reproduce the same thing in the Debug mode that happened in Production mode,
when 99.99 % of the results are OK, and you can not place the tools at the same position on images
from the repair station. And also fine tuning the models requires a machine to run the boards in debug
mode.
Using the production debug tool, you can use images and data from the production mode to optimize
your models afterwards.
When the production debug tool is active during production mode, it captures all the necessary data
(clipped images, machine calibration data, and models data), each time a model returns an error. It
saves them into archives (*.dbg files) that you can open and analyze in debug mode. One of the key
features of this tool is that the archives are not machine dependant, because they contain the cali-
bration data of the machine that created them. So you can use the archives on any machine (of the
same type) or stand alone station and obtain exactly the same results.
The production debug tool can be used to debug solder paste objects and all kinds of models, (Vi-
Pro, SO, QFP, Custom tools) except multi zone ones.
12.2.1 Production debug tool configuration
In the DefaultValue.ini file, you will find the necessary keys to set the production debug tool
active:
Open the DefaultValue.ini file with Notepad or any text editor, and find the [Production] sec-
tion. In this section, set the TraceFaults key to 1 to enable the debug tool, or 0 to disable it.
Set the Folder of dbg files key to the full path where you need to save the dbg files.
You can also set the maximum number of archives per panel you wish to save with the num-
ber of dbg file value.
Reload the INI parameters before starting production mode (close and restart Vision 2007 or
in Process menu, select Load ini file).
The TraceFaults value turns the Production debug tool on or off (1 = ON, 0 = OFF). This val-
ue is read each time you start a production session. This means you have to exit and re-enter
the Production mode if you need to turn on or off the production debug tool.
Please make sure that there is enough free space on the drive you specify.
The .dbg files are quite small archives, but a production session can create many
of them.
The TraceFaults function can be activated on production screen by clicking on Ctrl + D.