VI User Manual.pdf - 第337页
Optimization Vision 2007 4.10 User Manua l Rev 01 12 - 19 12.3.6.3 ADC library sorti ng Tick the check box ( A ) to change the ADC library arra ngement. If not, links from the standard libr ary will be added at the end .…
Optimization
12 - 18 Vision 2007 4.10 User Manual Rev 01
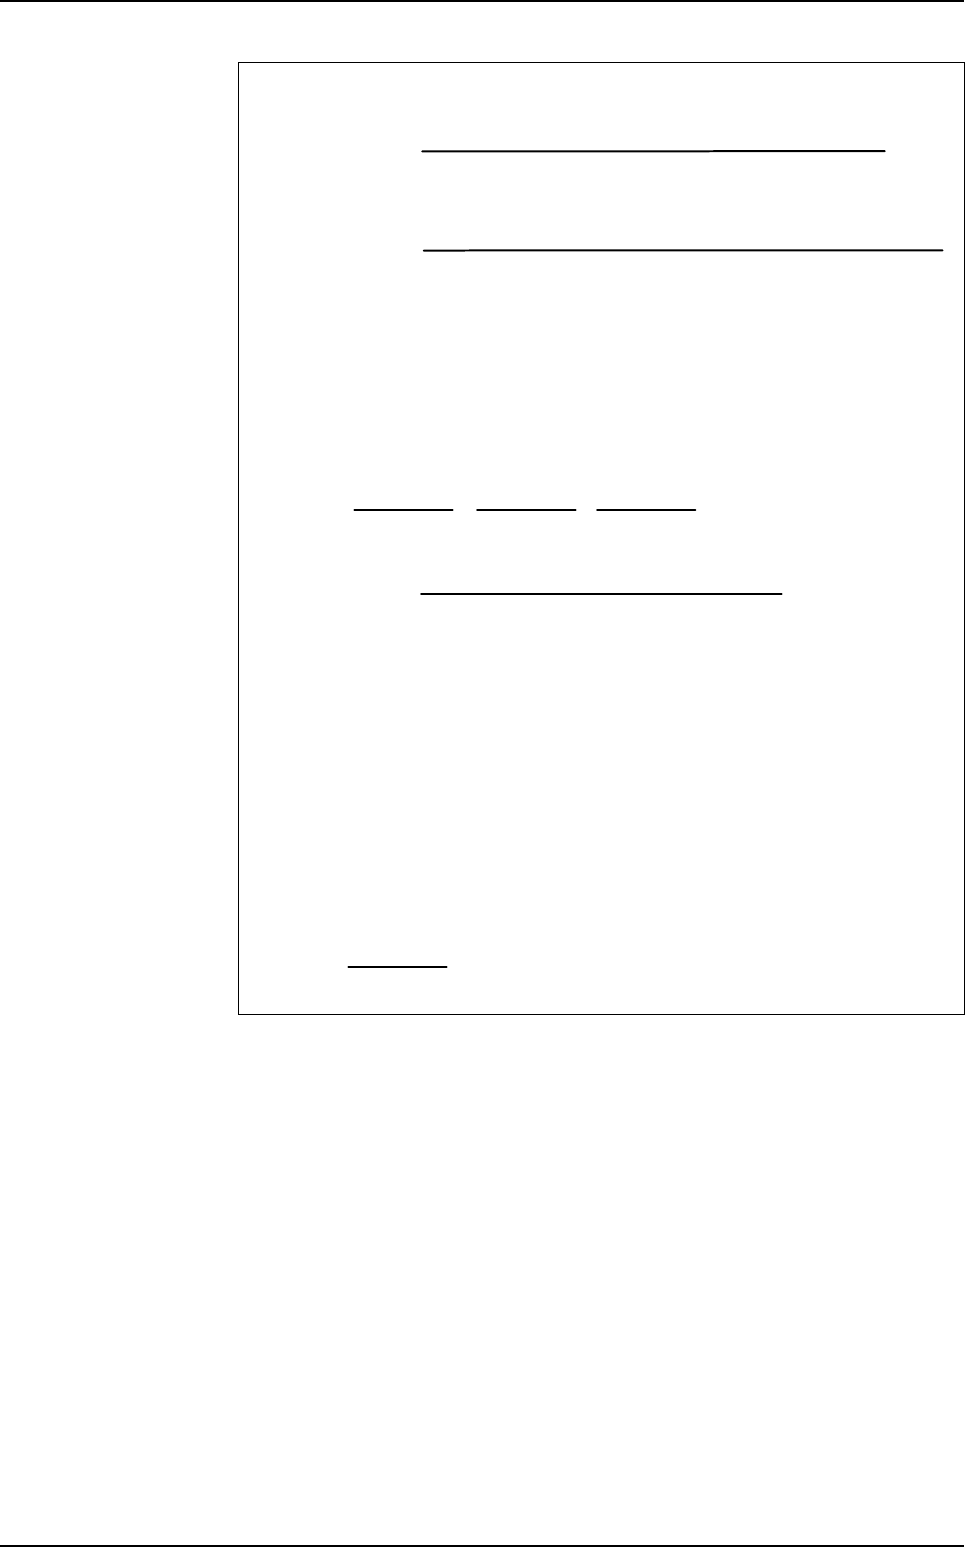
Formulas
This time calculation takes in account the rate of success of the link.
It indicates fastest link which validate a component with the highest score.
It is used to sort links in the ADC library.
If you let the cursor in the center position, the sort is not a slower link but with a higher
occurrence will be in the 1st position.
Number of times this link was the best (higher score)
Number of components tested with the same Jedec
% of winner =
x 100
Nb winner % winner Nb pass Score average
C1005 20 4% 120
Σ
(scores) / 120
C1005A 300 60% 360
Σ
(scores) / 360
C1005B 180 36% 200
Σ
(scores) / 200
None 20 4 %
500 100 0<…<1500
120
360
200
Example: 500 components C1005 tested
Sum of the scores when a component passes with this link
Number of times the link passes
Score average =
Sum of the inspection times for this link
Number of times this link was the winner
Time =
Example: 500 components C1005 tested
Nb winner Time
C1005 20
Σ
(scores) / 20
C1005A 290
Σ
(scores) / 290
C1005B 170
Σ
(scores) / 170
None 20
500
500
500
500
Auto Defect Correction (ADC)
Optimization
Vision 2007 4.10 User Manual Rev 01 12 - 19
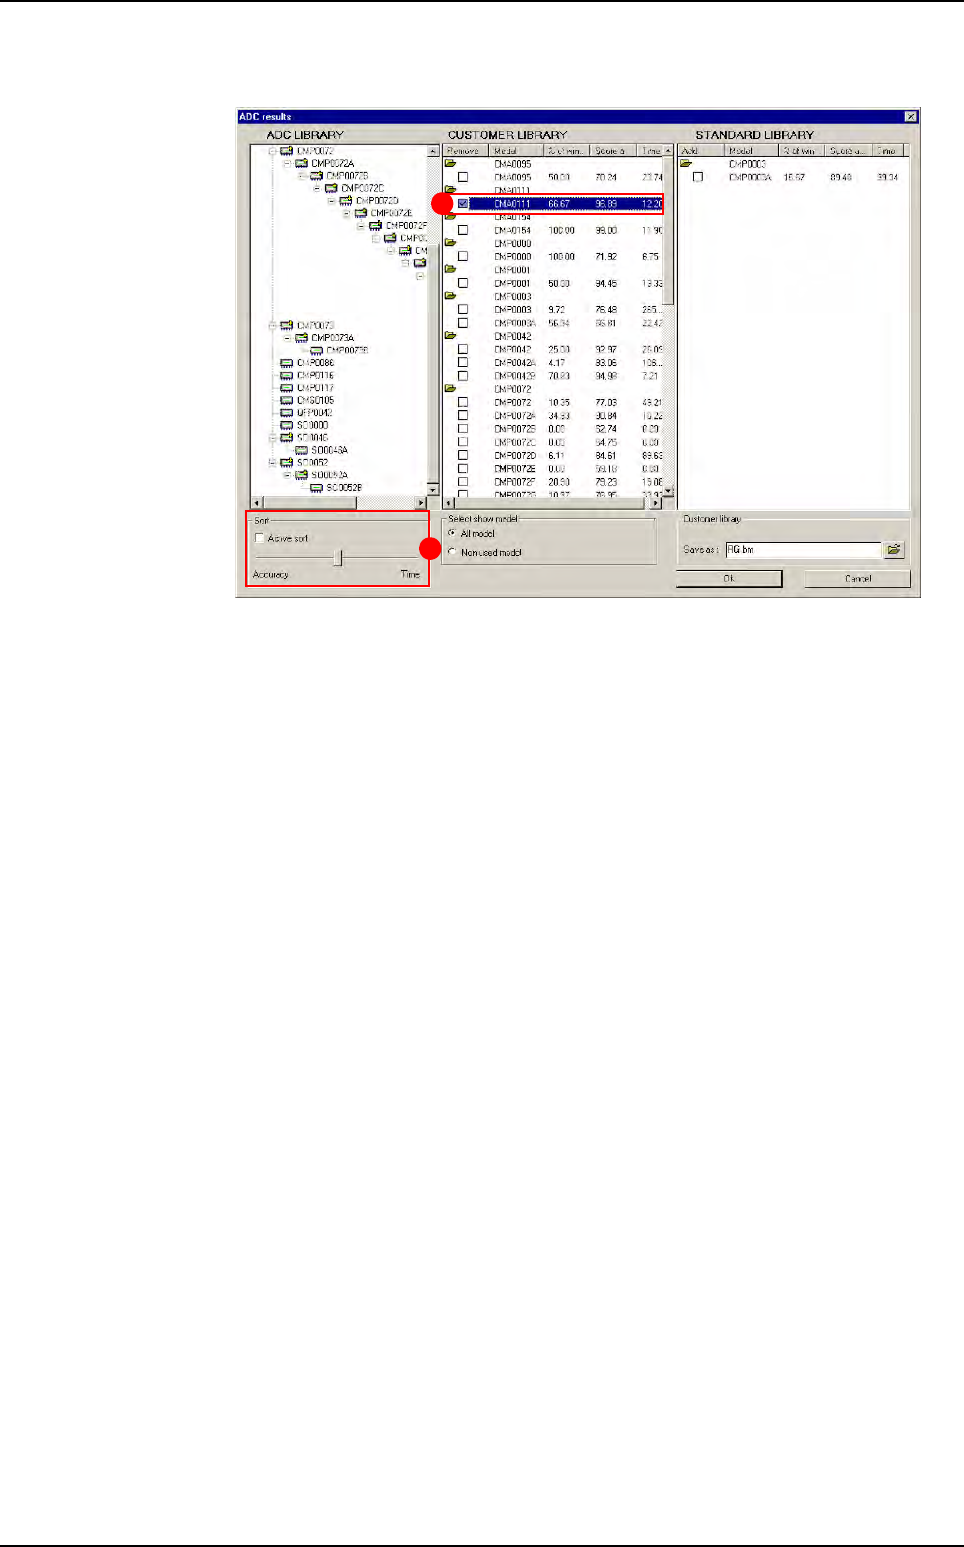
12.3.6.3 ADC library sorting
Tick the check box (A) to change the ADC library arrangement. If not, links from the
standard library will be added at the end.
In
Sort (B) section, move the cursor to the Time indication to have fastest links in
the 1st position. Move the cursor to the
Accuracy indication to have links with high-
est scores in the 1st position.
A
B
Auto Defect Correction (ADC)
Optimization
12 - 20 Vision 2007 4.10 User Manual Rev 01
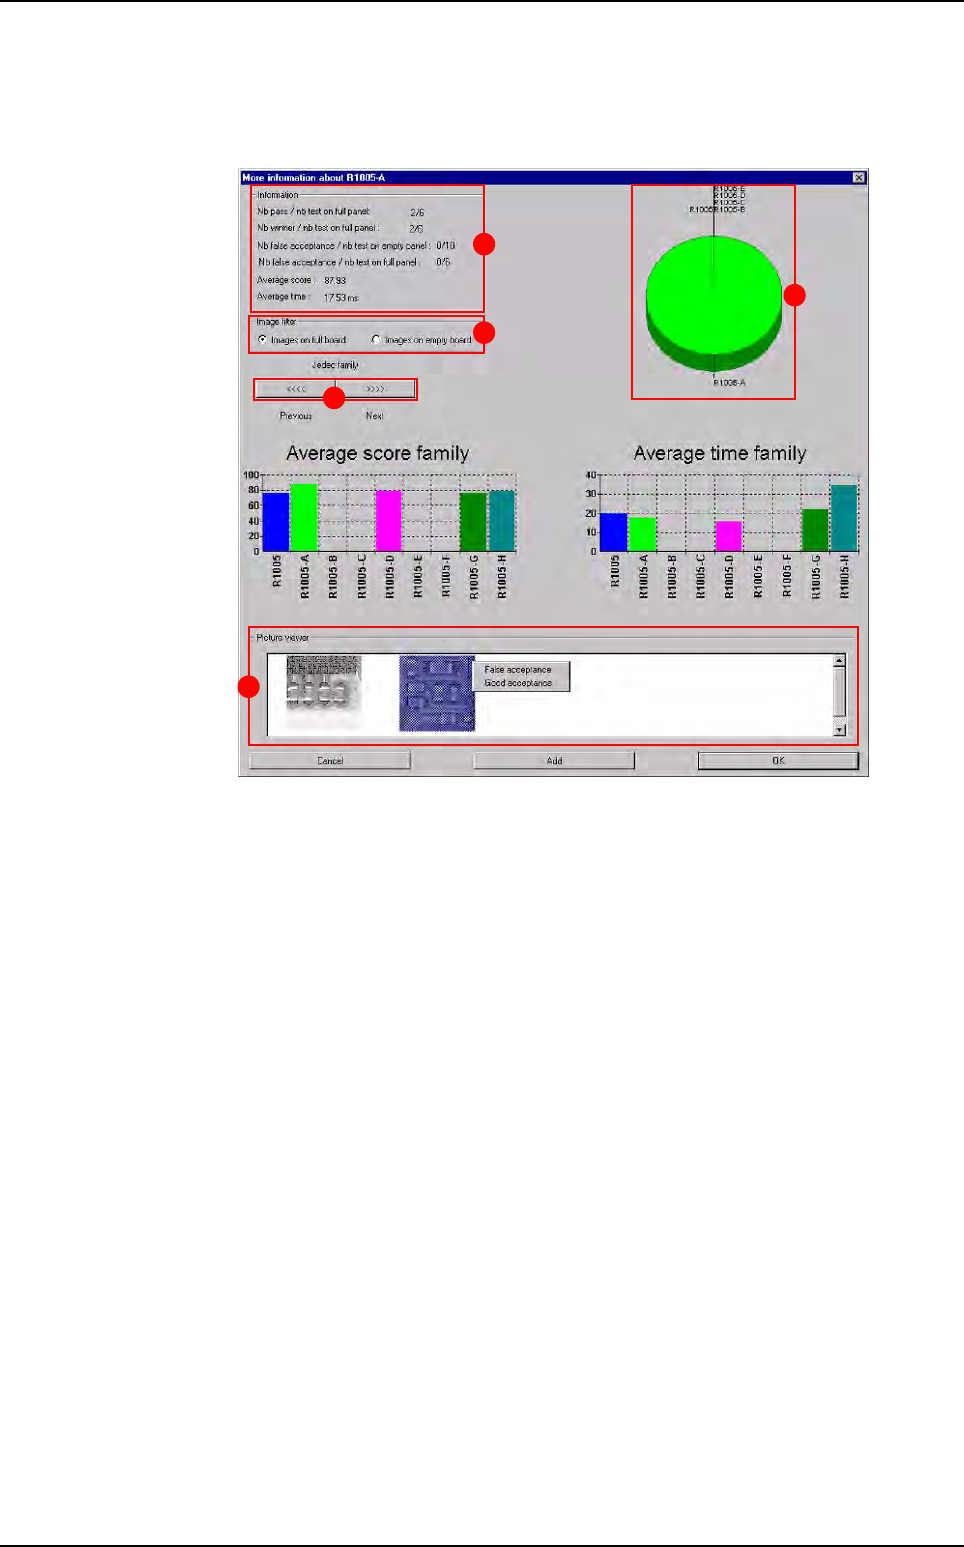
12.3.6.4 More details
By double clicking on a model from the Customer or Standard library, the window
below appears.
In
Information (A) section:
Nb pass/nb test on full panel: number of times this link has found the compo-
nent (sufficient score).
Nb winner/nb test on full panel: number of times this link gave the best score.
Nb false acceptance/nb test on empty panel: number of times the model gave
false acceptances on empty panel.
Nb false acceptance/nb test on full panel: number of times the model gave
false acceptances on full panel.
Average score: sum of the scores divided by the number of times components
passed with this link.
Average time: sum of the inspection times divided by the number of times the
link wons.
In
Image filter (B) section, select the images from empty or full board. For models
from the standard library, you can see pictures on the detail screen. These pictures
are taken when a standard model validates a component.
Press
<<<< or >>>> (C) button to see the next or previous links.
The pie chart (
D) shows you the links distribution for one family of components ac-
cording to the winner %.
In
Picture viewer (E) section, use the right click on images to agree the inspection
result or to change statistics if it corresponds to a false acceptance:
Good acceptance
: the vision result is good. You will delete this image from your disk,
False acceptance: the vision result is wrong. You will change statistics and de-
lete the image.
A
C
D
E
B
Auto Defect Correction (ADC)