VI User Manual.pdf - 第343页
Optimization Vision 2007 4.10 User Manua l Rev 01 12 - 25 12.4.2.6 Computing results On the Results window, settings calcu lated by the auto setting for e a ch Profiler ™ are displayed. To put this setting in the library…
Optimization
12 - 24 Vision 2007 4.10 User Manual Rev 01
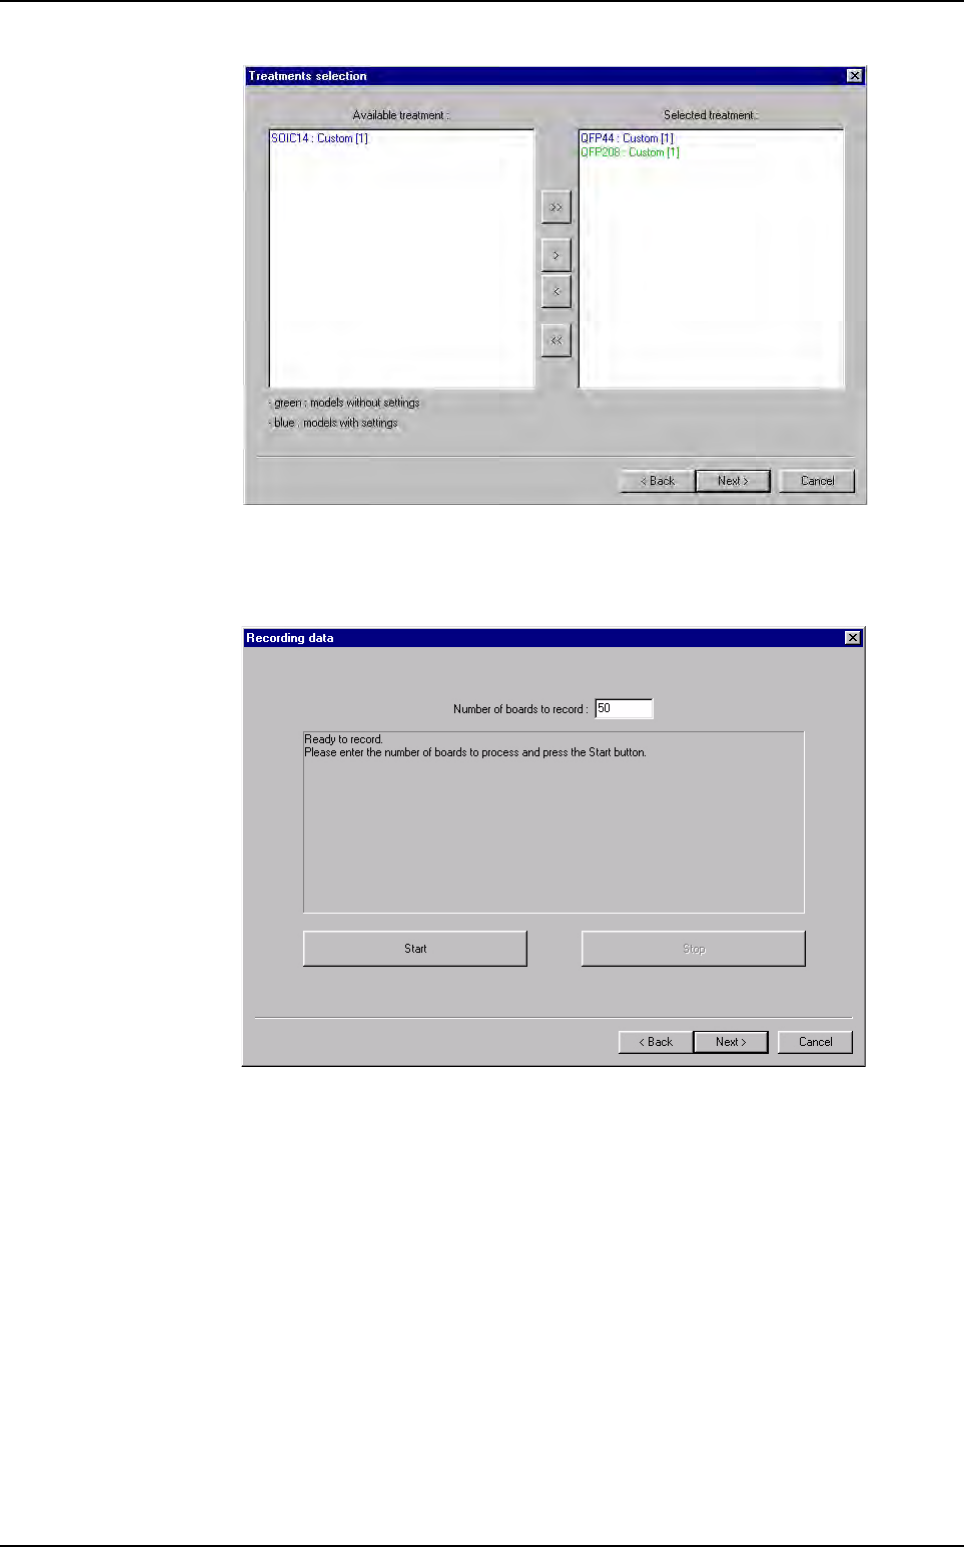
12.4.2.5 Recording data
Define the number of board to put.
Click on
Start button. To stop the auto setting before the end, click on Stop button.
The result of auto setting is also calculated on board saved pass.
At the end, click on
Next > button.
Profiler
™
Automatic Setting
Optimization
Vision 2007 4.10 User Manual Rev 01 12 - 25
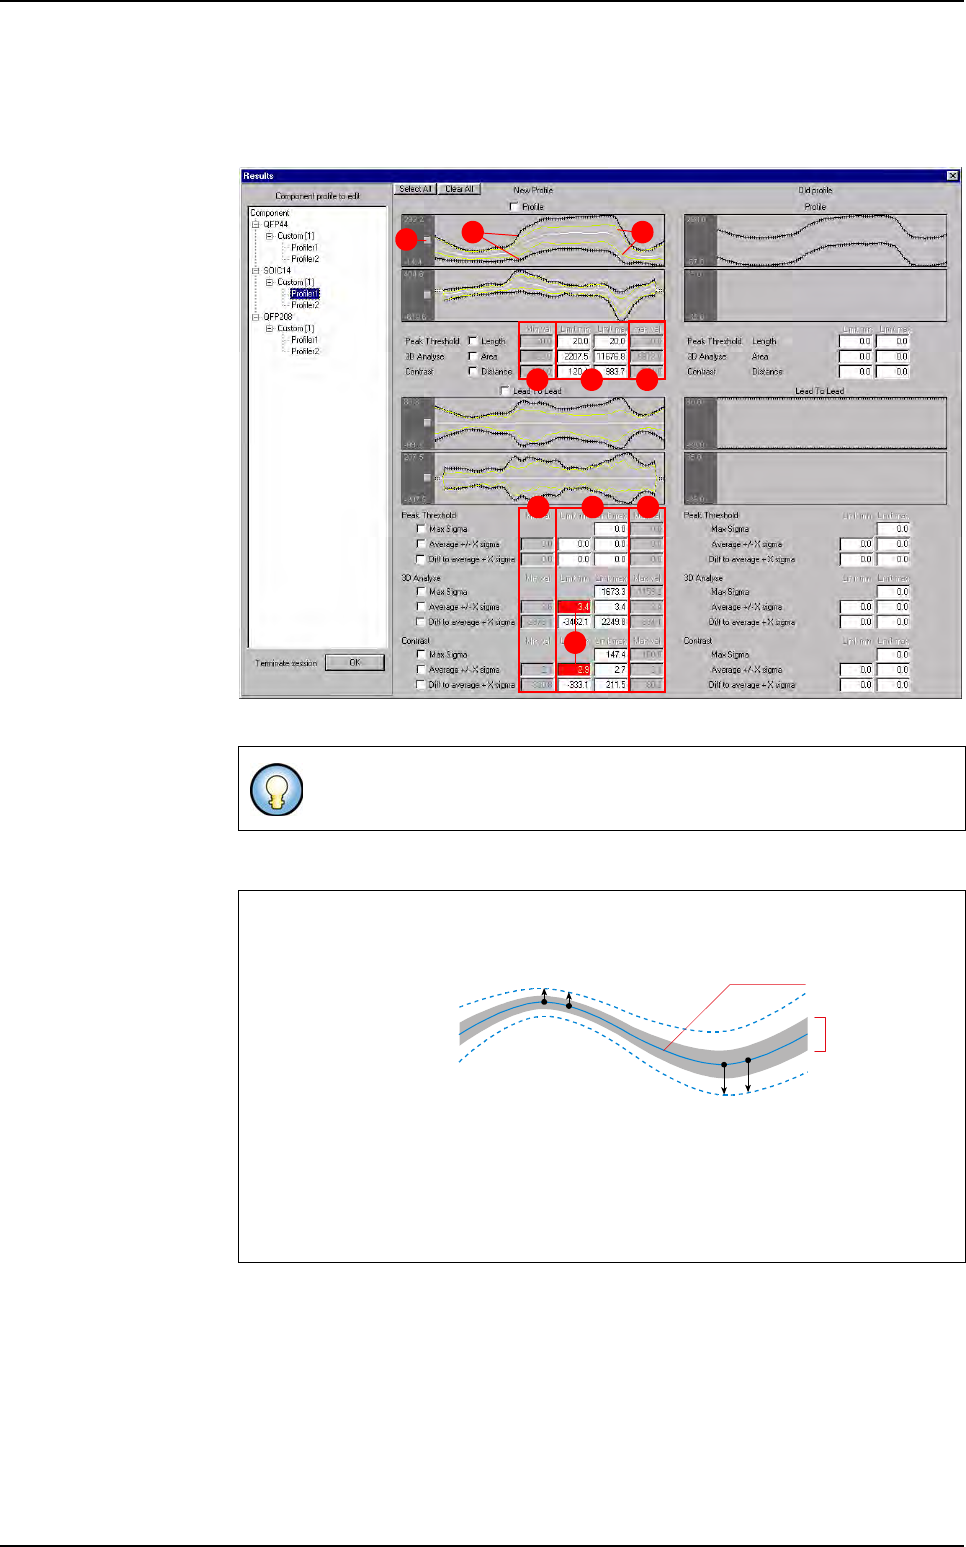
12.4.2.6 Computing results
On the Results window, settings calculated by the auto setting for each Profiler™
are displayed.
To put this setting in the library, tick the box near each setting.
A In black, the tolerances calculated by the auto setting.
B In yellow, the profile minimum and maximum measured during the recording.
C For each algorithm, the limits calculated by the auto setting.
D
For each algorithm, the minimum and the maximum calculated during the recording.
E When algorithm limits do not include all results, the window is colored in red. If
you want, you can change it.
To select all settings click on
Select All
button.
To unselect all settings already ticked, click on
Clear All
button.
How tolerances are calculated
For each point of the
profile, the sigma is
calculated. the toler-
ance point are calcu-
lated with the
following statistical
formula:
Average +/- X sigma
By default X = 3 to enlarge tolerances (This value can be changed in the .ini file.
If this value increased, tolerances are larger).
The same principle is apply to calculate the limit of the
Expert mode
algorithm.
CD D
CD D
E
A B
F
Average - X sigma
All profiles
average
P
n
= Average
n
+ X
σ
n
The whole
of profiles
collected during
the auto setting
P
10
P
11
Average + X sigma
P
20
P
21
Profiler™ Automatic Setting
Optimization
12 - 26 Vision 2007 4.10 User Manual Rev 01
F Click on the button near the profile to zoom on it.
Tolerances (
A), in black, are calculated by statistic.
You can move tolerances manually to include minimum and maximum profiles (If
you are absolutely sure that all your lead/joint are good).
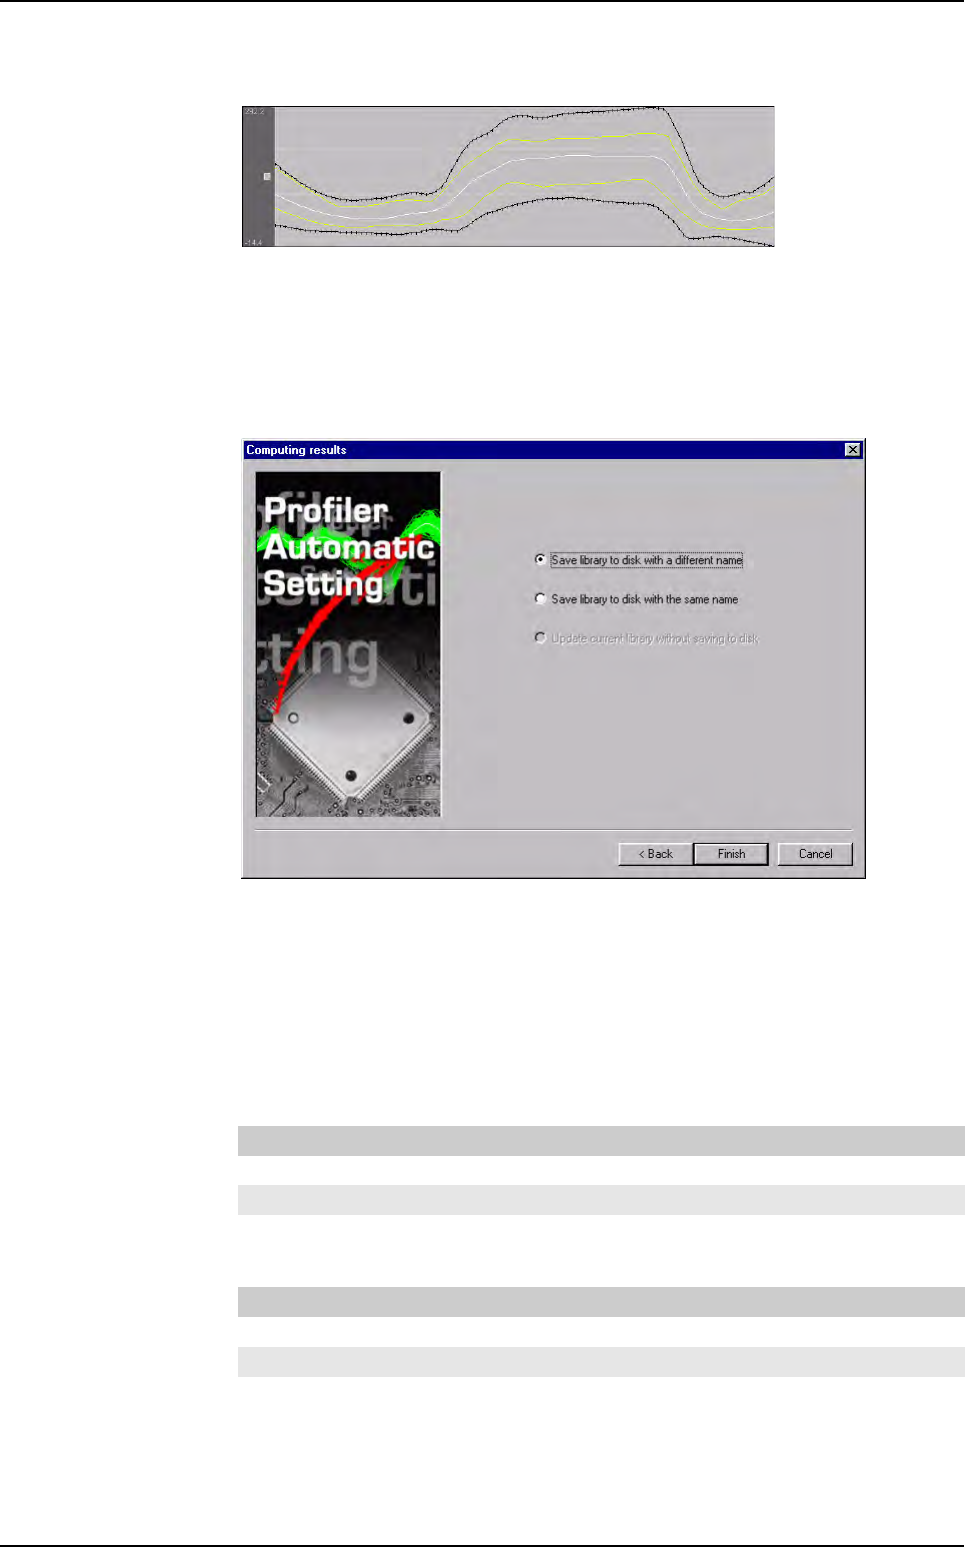
In the window belove, save the library on the disk, either with a same name, or with
an other name.
Click on
Finish
button.
12.4.3 Profiler Automatic Setting default values
Open the Defaultvalue.ini file to access the Auto settings (Profiler and Lead to Lead) pa-
rameters.
12.4.3.1 Profiler
12.4.3.2 Lead to lead
[Profiler(Auto settings)]
Xmin_Algoname=3
Xmax_Algoname=3
[Lead2Lead(Auto settings)]
Xmin_Algoname=3
Xmax_Algoname=3
Profiler
™
Automatic Setting